Trenton: Fire Incidents, Tennessee (TN)
Where are fire incidents reported in Trenton, TN
Something went wrong! Please refresh the page.
|
| |||||||||||||||||||||||||||||||||||||||||||||||||||||||||||||||||||||||||||||||||||||||||||||||||||||||||||||
| Other | 247 | |||||||||||||||||||||||||||||||||||||||||||||||||||||||||||||||||||||||||||||||||||||||||||||||||||||||||||||
2003 - 2018 National Fire Incident Reporting System (NFIRS) incidents
- Incident types reported to NFIRS in Trenton, TN
- 2,93852.4%Rescue & EMS
- 1,31723.5%Fire
- 5309.4%Hazardous Condition
- 3826.8%Service Call
- 2314.1%Good Intent Call
- 1582.8%False Alarm
- 420.7%Severe Weather
- 140.2%Special Incident
- Fire incident types reported to NFIRS in Trenton, TN
- 58944.7%Outside Fires
- 51939.4%Structure Fires
- 14511.0%Mobile Property/Vehicle Fires
- 644.9%Other
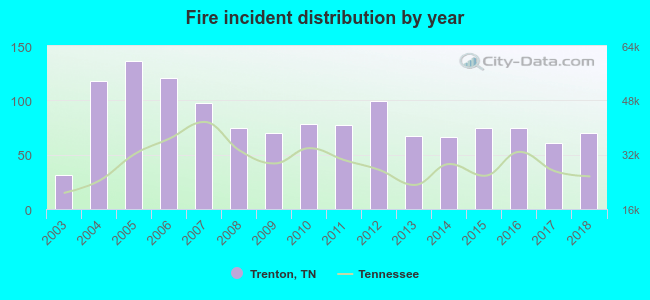 Based on the data from the years 2003 - 2018 the average number of fires per year is 82. The highest number of fire incidents - 136 took place in 2005, and the least - 31 in 2003. The data has a growing trend.
 The median response time based on all reported fire incidents is 6 minutes. This is close to the state median value.
The median response time in Trenton, TN compared to nearest cities:
(Note: Based on data for all years, including only cities with at least 500 fire incidents)
| Trenton: | 6 minutes |
| Humboldt: | 4 minutes |
| Milan: | 6 minutes |
| Newbern: | 8 minutes |
| Jackson: | 6 minutes |
| Dyersburg: | 5 minutes |
| Dresden: | 5 minutes |
| Martin: | 5 minutes |
| McKenzie: | 6 minutes |
 According to the reports from the years 2003 - 2018 the average number of fire-related fatalities per year is 1. The highest number of deaths - 3 took place in 2004, and the lowest - 0 in 2003. The data has a constant trend.
 27.6% incidents where reported in the morning and 72.4% in the evening. The most fires (15.9%) took place on Saturday, and the least (12.8%) on Tuesday.
 Based on the 1,317 fires from years 2003 - 2018 most fires (13.0%) took place during March, and the least (5.0%) in May.
 Out of all 5,612 cases reported during the years 2003 - 2018, the most belonged to the categories: Overpressure Rupture (52.4%), Fire (23.5%), and Rescue & EMS (9.4%).
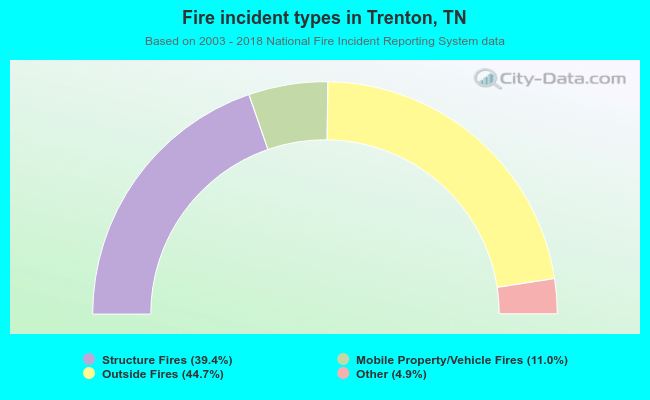 When looking into fire subcategories, the most incidents belonged to: Outside Fires (44.7%), and Structure Fires (39.4%).