Mequon: Fire Incidents, Wisconsin (WI)
Where are fire incidents reported in Mequon, WI
Something went wrong! Please refresh the page.
|
| |||||||||||||||||||||||||||||||||||||||||||||||||||||||||||||||||||||||||||||||||||||||||||||||||||||||||||||
2002 - 2018 National Fire Incident Reporting System (NFIRS) incidents
- Incident types reported to NFIRS in Mequon, WI
- 1,64144.2%Rescue & EMS
- 66517.9%Hazardous Condition
- 56315.2%False Alarm
- 45712.3%Fire
- 1754.7%Good Intent Call
- 1624.4%Service Call
- 200.5%Severe Weather
- 160.4%Overpressure Rupture
- 120.3%Special Incident
- Fire incident types reported to NFIRS in Mequon, WI
- 23250.8%Structure Fires
- 11424.9%Outside Fires
- 7416.2%Mobile Property/Vehicle Fires
- 378.1%Other
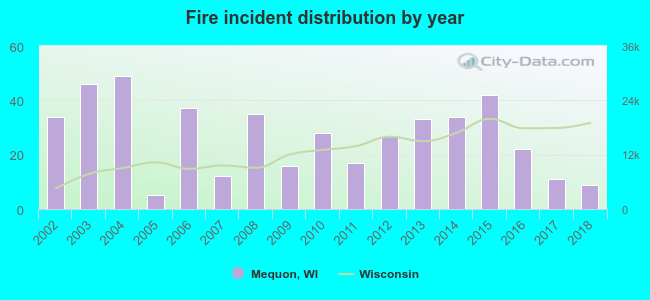 Based on the data from the years 2002 - 2018 the average number of fires per year is 27. The highest number of fire incidents - 49 took place in 2004, and the least - 5 in 2005. The data has a declining trend.
The average number of yearly fire incidents per 10k residents in Mequon, WI compared to nearest cities:
(Note: Based on data for the last 3 years, including only cities with population 5,000 and above)
| Mequon: | 6.0 |
| Brown Deer: | 13.5 |
| Fox Point: | 10.9 |
| Cedarburg: | 15.9 |
| Grafton: | 15.9 |
| Glendale: | 23.0 |
| Germantown: | 31.0 |
| Whitefish Bay: | 7.1 |
| Menomonee Falls: | 22.0 |

 28.4% incidents where reported in the morning and 71.6% in the evening. The most fires (17.5%) took place on Monday, and the least (10.3%) on Tuesday.
 According to the 457 fire incident reports from years 2002 - 2018 most fires (10.9%) took place during April, and the least (3.7%) in November.
 Out of all 3,711 cases reported during the years 2002 - 2018, the most belonged to the categories: Rescue & EMS (44.2%), Hazardous Condition (17.9%), and False Alarm (15.2%).
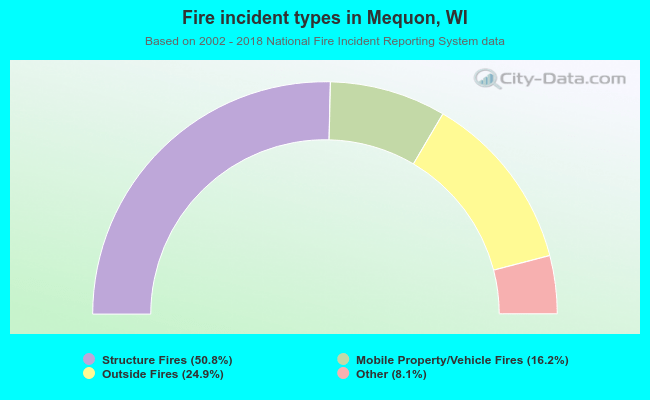 When looking into fire subcategories, the most reports belonged to: Structure Fires (50.8%), and Outside Fires (24.9%).