Grafton: Fire Incidents, Wisconsin (WI)
Where are fire incidents reported in Grafton, WI
Something went wrong! Please refresh the page.
|
| |||||||||||||||||||||||||||||||||||||||||||||||||||||||||||||||||||||||||||||||||||||||||||||||||||||||||||||
2004 - 2018 National Fire Incident Reporting System (NFIRS) incidents
- Incident types reported to NFIRS in Grafton, WI
- 93546.1%Rescue & EMS
- 39119.3%Fire
- 35717.6%Hazardous Condition
- 1326.5%False Alarm
- 1095.4%Good Intent Call
- 984.8%Service Call
- 30.1%Overpressure Rupture
- Fire incident types reported to NFIRS in Grafton, WI
- 18246.5%Structure Fires
- 12231.2%Outside Fires
- 6917.6%Mobile Property/Vehicle Fires
- 184.6%Other
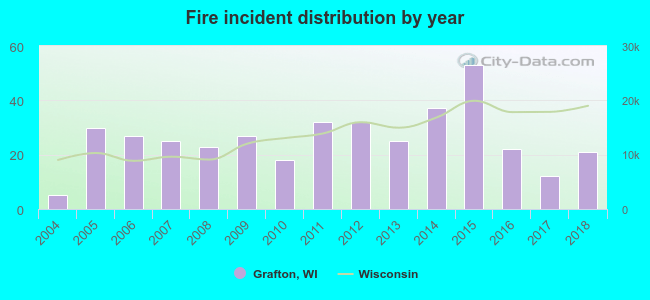 According to the data from the years 2004 - 2018 the average number of fire incidents per year is 26. The highest number of reported fires - 53 took place in 2015, and the least - 5 in 2004. The data has an increasing trend.
The average number of yearly fire incidents per 10k residents in Grafton, WI compared to nearest cities:
(Note: Based on data for the last 3 years, including only cities with population 5,000 and above)
| Grafton: | 15.9 |
| Cedarburg: | 15.9 |
| Port Washington: | 19.9 |
| Mequon: | 6.0 |
| Brown Deer: | 13.5 |
| Germantown: | 31.0 |
| Jackson: | 27.4 |
| Fox Point: | 10.9 |
| Glendale: | 23.0 |

 33.8% incidents where reported in the morning and 66.2% in the evening. The most fires (20.7%) took place on Thursday, and the least (9.5%) on Tuesday.
 Based on the 391 fires from years 2004 - 2018 most fires (13.8%) took place during May, and the least (4.6%) in September.
 Out of all 2,027 cases reported during the years 2004 - 2018, the most belonged to the categories: Rescue & EMS (46.1%), Fire (19.3%), and Hazardous Condition (17.6%).
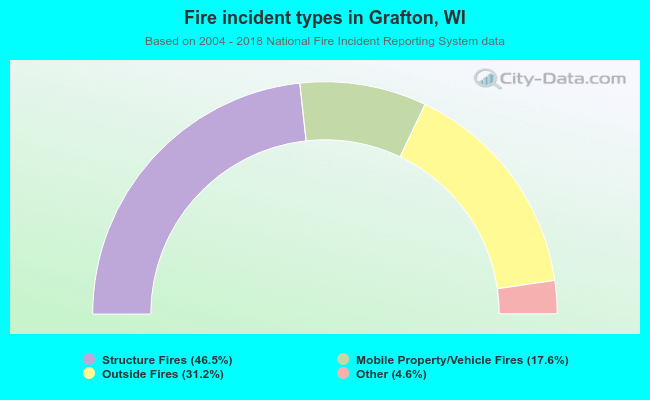 When looking into fire subcategories, the most reports belonged to: Structure Fires (46.5%), and Outside Fires (31.2%).