Miami Shores: Fire Incidents, Florida (FL)
Where are fire incidents reported in Miami Shores, FL
Something went wrong! Please refresh the page.
|
| |||||||||||||||||||||||||||||||||||||||||||||||||||||||||||||||||||||||||||||||||||||||||||||||||||||||||||||
2008 - 2018 National Fire Incident Reporting System (NFIRS) incidents
- Incident types reported to NFIRS in Miami Shores, FL
- 3,19471.5%Rescue & EMS
- 4129.2%Good Intent Call
- 3076.9%False Alarm
- 2164.8%Hazardous Condition
- 2054.6%Service Call
- 1312.9%Fire
- Fire incident types reported to NFIRS in Miami Shores, FL
- 5844.3%Structure Fires
- 3627.5%Mobile Property/Vehicle Fires
- 3325.2%Outside Fires
- 43.1%Other
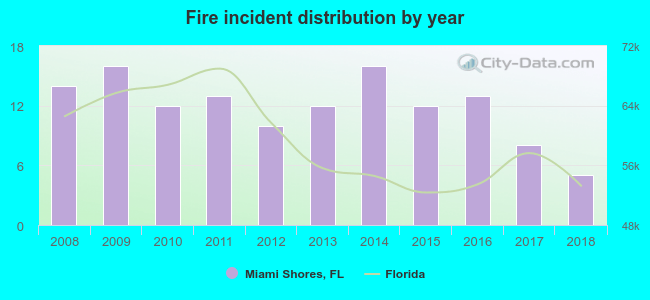 According to the data from the years 2008 - 2018 the average number of fire incidents per year is 12. The highest number of reported fire incidents - 16 took place in 2009, and the least - 5 in 2018. The data has a decreasing trend.
The average number of yearly fire incidents per 10k residents in Miami Shores, FL compared to nearest cities:
(Note: Based on data for the last 3 years, including only cities with population 5,000 and above)
| Miami Shores: | 8.0 |
| North Miami: | 18.8 |
| North Bay Village: | 8.9 |
| Bay Harbor Islands: | 5.0 |
| Surfside: | 6.7 |
| North Miami Beach: | 12.4 |
| Miami Beach: | 6.6 |
| Miami: | 21.7 |
| Sunny Isles Beach: | 12.6 |
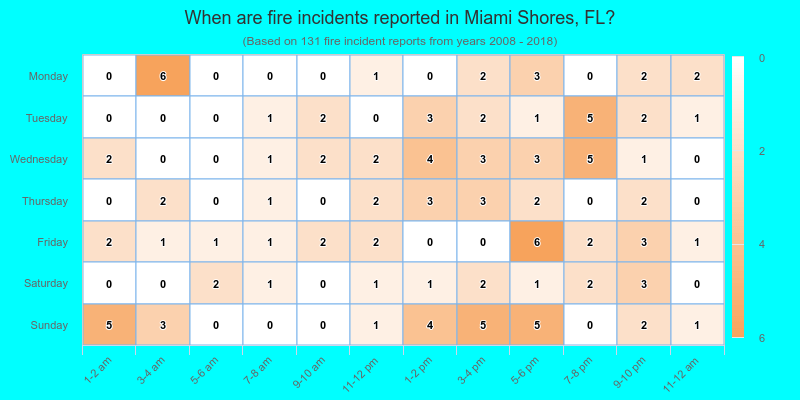
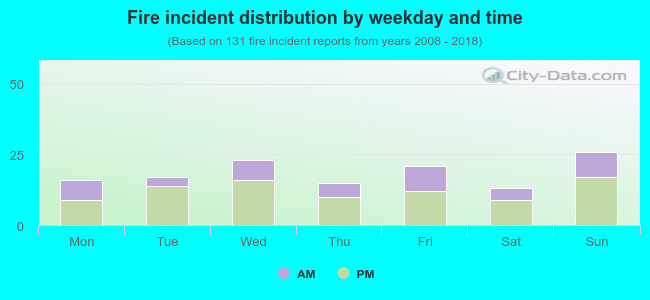 33.6% incidents where reported in the morning and 66.4% in the evening. The most fires (19.8%) took place on Sunday, and the least (9.9%) on Saturday.
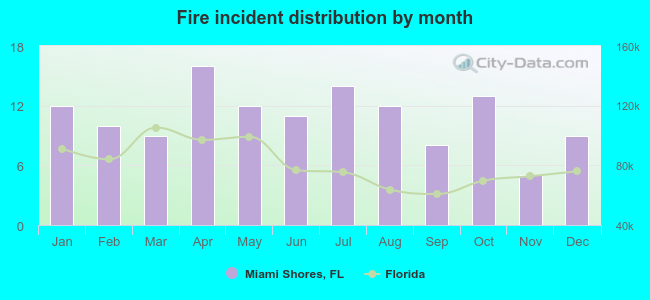 According to the 131 fire incident reports from years 2008 - 2018 most fires (12.2%) took place during April, and the least (3.8%) in November.
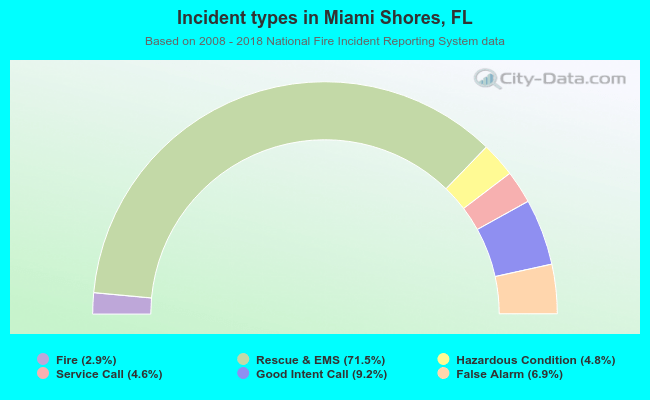 Out of all 4,465 cases reported during the years 2008 - 2018, the most belonged to the categories: Overpressure Rupture (71.5%), Service Call (9.2%), and Good Intent Call (6.9%).
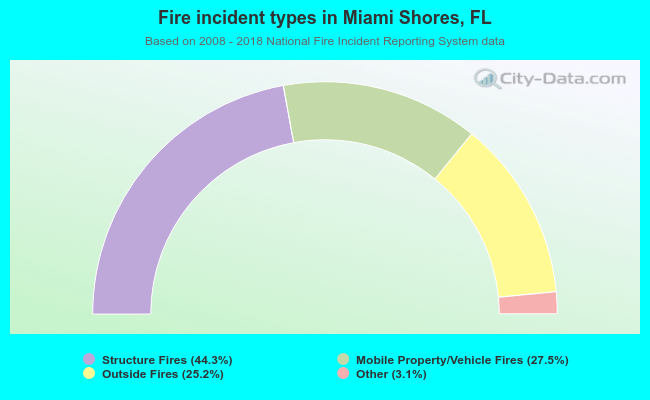 When looking into fire subcategories, the most reports belonged to: Structure Fires (44.3%), and Mobile Property/Vehicle Fires (27.5%).