North Miami: Fire Incidents, Florida (FL)
Where are fire incidents reported in North Miami, FL
Something went wrong! Please refresh the page.
| Fire incidents reported | |
|---|---|
| Sreet name | Count |
| BISCAYNE BLVD | 106 |
| 6TH AVE | 96 |
| 125TH ST | 54 |
| 135TH ST | 52 |
| 18TH AVE | 52 |
| 123RD ST | 48 |
| 125 ST | 42 |
| 6 AVE | 40 |
| DIXIE HWY | 40 |
| 7TH AVE | 38 |
| 127TH ST | 30 |
| 130TH ST | 30 |
| 163RD ST | 30 |
| 121 ST | 28 |
| NW 125TH STI95 EXPY | 28 |
| NW 135TH STI95 EXPY | 28 |
| 10TH AVE | 26 |
| 119TH ST | 26 |
| 135 ST | 26 |
| 3RD CT | 26 |
| ROYAL OAKS LN | 26 |
| 128TH ST | 24 |
| 18 AVE | 24 |
| 122ND ST | 22 |
| 123 ST | 22 |
| 124TH ST | 22 |
| 7 AVE | 22 |
| SANS SOUCI BLVD | 22 |
| 13TH AVE | 20 |
| 143RD ST | 20 |
| Other | 333 |
2008 - 2018 National Fire Incident Reporting System (NFIRS) incidents
- Incident types reported to NFIRS in North Miami, FL
- 28,33075.5%Rescue & EMS
- 2,6487.1%Good Intent Call
- 2,3686.3%False Alarm
- 1,6704.5%Service Call
- 1,4033.7%Fire
- 1,0732.9%Hazardous Condition
- Fire incident types reported to NFIRS in North Miami, FL
- 58241.5%Structure Fires
- 41629.7%Outside Fires
- 38627.5%Mobile Property/Vehicle Fires
- 191.4%Other
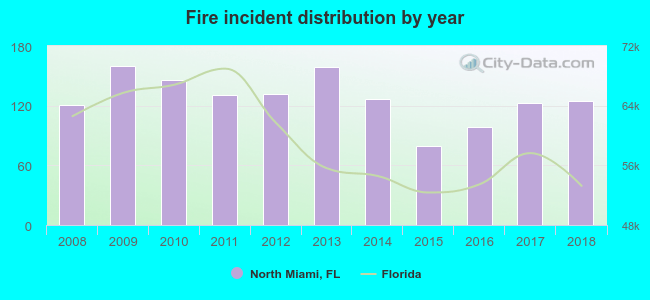 Based on the data from the years 2008 - 2018 the average number of fire incidents per year is 127. The highest number of fires - 160 took place in 2009, and the least - 79 in 2015. The data has an increasing trend.
The average number of yearly fire incidents per 10k residents in North Miami, FL compared to nearest cities:
(Note: Based on data for the last 3 years, including only cities with population 5,000 and above)
| North Miami: | 18.8 |
| Miami Shores: | 8.0 |
| North Miami Beach: | 12.4 |
| Bay Harbor Islands: | 5.0 |
| Surfside: | 6.7 |
| North Bay Village: | 8.9 |
| Sunny Isles Beach: | 12.6 |
| Aventura: | 9.7 |
| Pembroke Park: | 42.9 |
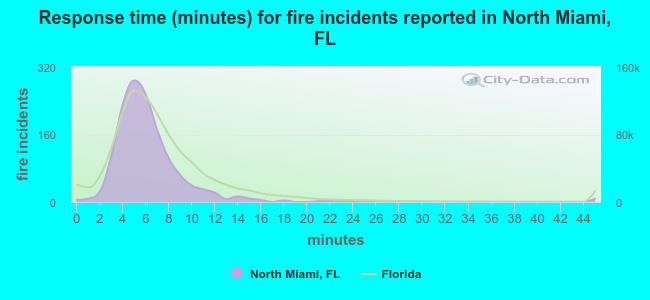 The median response time based on all reported fire incidents is 6 minutes. This is about the same as the Florida median value.
The median response time in North Miami, FL compared to nearest cities:
(Note: Based on data for all years, including only cities with at least 500 fire incidents)
| North Miami: | 6 minutes |
| North Miami Beach: | 6 minutes |
| Miami Gardens: | 6 minutes |
| West Park: | 5 minutes |
| Hallandale: | 5 minutes |
| Hialeah: | 7 minutes |
| Miami: | 5 minutes |
| Miramar: | 6 minutes |
| Hollywood: | 6 minutes |
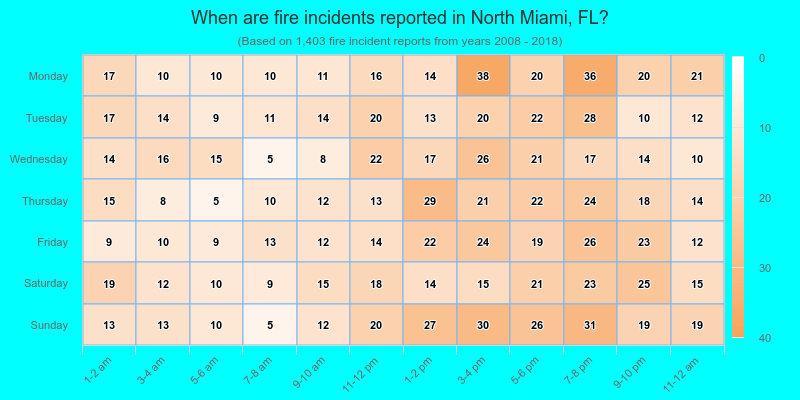
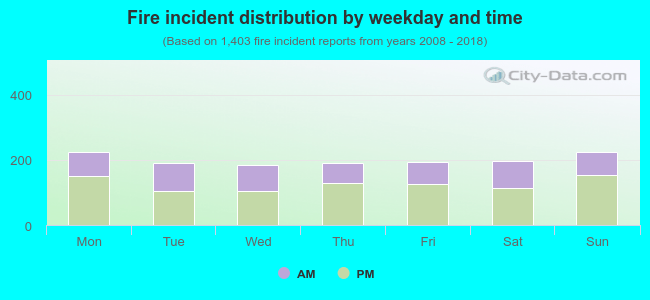 37.4% incidents where reported in the morning and 62.6% in the evening. The most fires (16.0%) took place on Sunday, and the least (13.2%) on Wednesday.
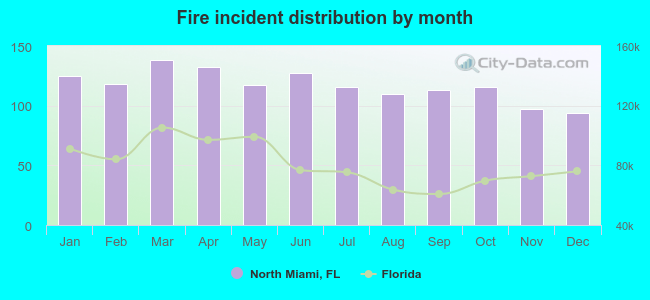 Based on the 1,403 incident reports from years 2008 - 2018 most fires (9.8%) took place during March, and the least (6.7%) in December.
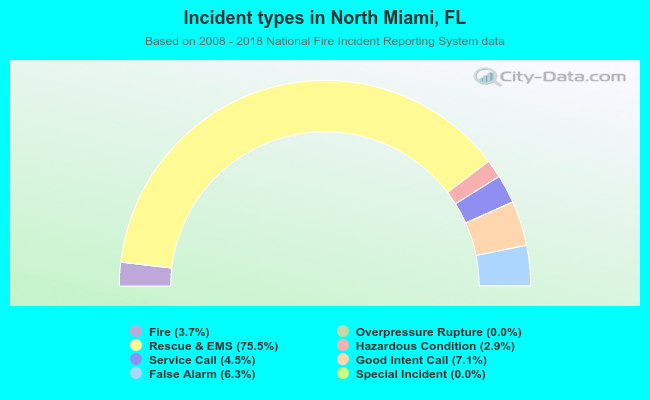 Out of all 37,505 cases reported during the years 2008 - 2018, the most belonged to the categories: Rescue & EMS (75.5%), Good Intent Call (7.1%), and False Alarm (6.3%).
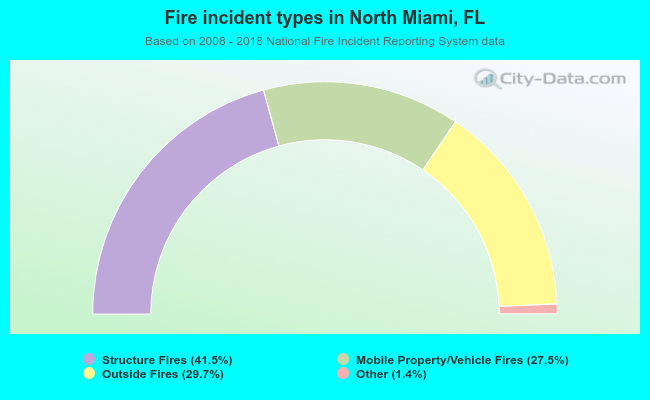 When looking into fire subcategories, the most incidents belonged to: Structure Fires (41.5%), and Outside Fires (29.7%).