Middletown: Fire Incidents, Indiana (IN)
Where are fire incidents reported in Middletown, IN
Something went wrong! Please refresh the page.
|
| |||||||||||||||||||||||||||||||||||||||||||||||||||||||||||||||||||||||||||||||||||||||||||||||||||||||||||||
2002 - 2017 National Fire Incident Reporting System (NFIRS) incidents
- Incident types reported to NFIRS in Middletown, IN
- 1,12654.3%Rescue & EMS
- 52025.1%Fire
- 23611.4%Hazardous Condition
- 1075.2%Good Intent Call
- 482.3%Service Call
- 301.4%False Alarm
- 70.3%Severe Weather
- Fire incident types reported to NFIRS in Middletown, IN
- 24847.7%Structure Fires
- 19036.5%Outside Fires
- 5310.2%Mobile Property/Vehicle Fires
- 295.6%Other
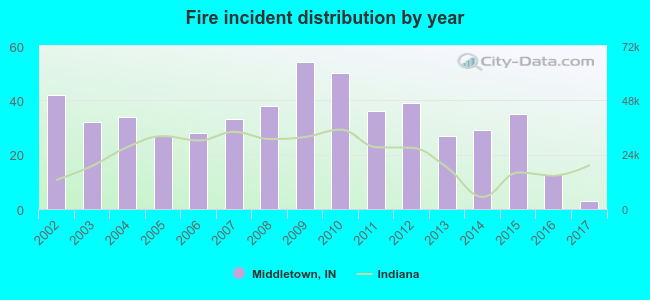 Based on the data from the years 2002 - 2017 the average number of fires per year is 33. The highest number of fire incidents - 54 took place in 2009, and the least - 3 in 2017. The data has a dropping trend.
 The median response time based on all reported fire incidents is 6 minutes. This is similar to the state median value.
The median response time in Middletown, IN compared to nearest cities:
(Note: Based on data for all years, including only cities with at least 500 fire incidents)
| Middletown: | 6 minutes |
| Daleville: | 8 minutes |
| Chesterfield: | 8 minutes |
| Anderson: | 7 minutes |
| Yorktown: | 9 minutes |
| Pendleton: | 8 minutes |
| Muncie: | 5 minutes |
| New Castle: | 3 minutes |
| Alexandria: | 5 minutes |
 31.5% incidents where reported in the morning and 68.5% in the evening. The most fires (17.1%) took place on Sunday, and the least (11.7%) on Wednesday.
 Based on the 520 fire incidents from years 2002 - 2017 most fires (16.0%) took place during March, and the least (4.6%) in July.
 Out of all 2,074 cases reported during the years 2002 - 2017, the most belonged to the categories: Overpressure Rupture (54.3%), Fire (25.1%), and Rescue & EMS (11.4%).
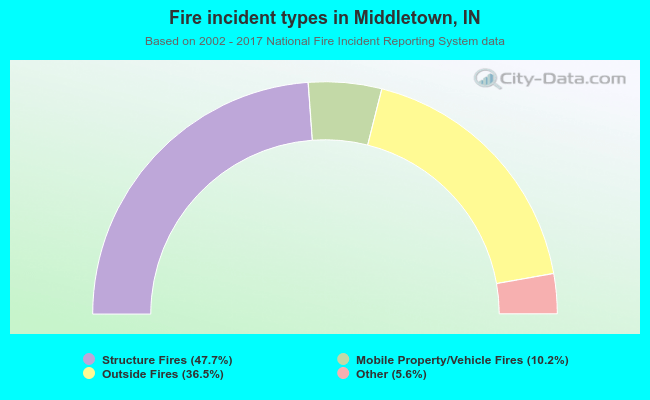 When looking into fire subcategories, the most incidents belonged to: Structure Fires (47.7%), and Outside Fires (36.5%).