New Castle: Fire Incidents, Indiana (IN)
Where are fire incidents reported in New Castle, IN
Something went wrong! Please refresh the page.
| Fire incidents reported | |
|---|---|
| Sreet name | Count |
| MEMORIAL DR | 90 |
| BROAD ST | 68 |
| MAIN ST | 64 |
| 14 ST | 60 |
| 12 ST | 44 |
| HILLSBORO RD | 40 |
| VINE ST | 38 |
| 100 RD | 36 |
| 400 RD | 36 |
| STATE ROAD 38 RD | 36 |
| 18 ST | 34 |
| 20 ST | 34 |
| 25 ST | 34 |
| STATE ROAD 3 HWY | 34 |
| 17 ST | 32 |
| B AVE | 32 |
| C AVE | 32 |
| COUNTY ROAD 300 NORTH RD | 32 |
| PLUM ST | 32 |
| SPRING ST | 32 |
| GRAND AVE | 30 |
| I AVE | 30 |
| D AVE | 28 |
| Q AVE | 28 |
| WESTERN ROAD RD | 28 |
| HIGHLAND | 26 |
| 16 ST | 24 |
| 22 ST | 24 |
| A AVE | 24 |
| WALNUT ST | 24 |
| Other | 1,001 |
2002 - 2017 National Fire Incident Reporting System (NFIRS) incidents
- Incident types reported to NFIRS in New Castle, IN
- 2,89030.7%Good Intent Call
- 2,25023.9%Rescue & EMS
- 2,10722.4%Fire
- 1,17012.4%Hazardous Condition
- 6907.3%Service Call
- 2863.0%False Alarm
- 170.2%Special Incident
- Fire incident types reported to NFIRS in New Castle, IN
- 88241.9%Outside Fires
- 71734.0%Structure Fires
- 26812.7%Mobile Property/Vehicle Fires
- 24011.4%Other
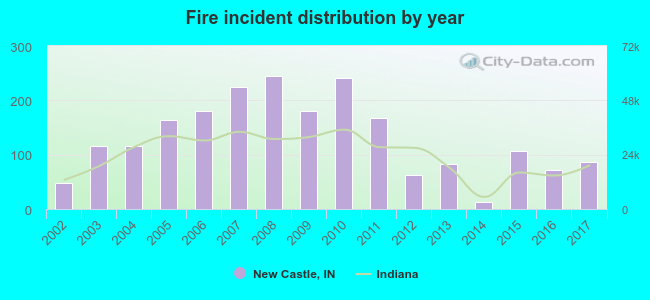 According to the data from the years 2002 - 2017 the average number of fire incidents per year is 132. The highest number of fires - 245 took place in 2008, and the least - 12 in 2014. The data has an increasing trend.
The average number of yearly fire incidents per 10k residents in New Castle, IN compared to nearest cities:
(Note: Based on data for the last 3 years, including only cities with population 5,000 and above)
| New Castle: | 30.4 |
| Yorktown: | 45.2 |
| Muncie: | 25.5 |
| Anderson: | 8.4 |
| Rushville: | 30.3 |
| Connersville: | 59.9 |
| Greenfield: | 36.8 |
| Richmond: | 3.6 |
| Alexandria: | 16.4 |
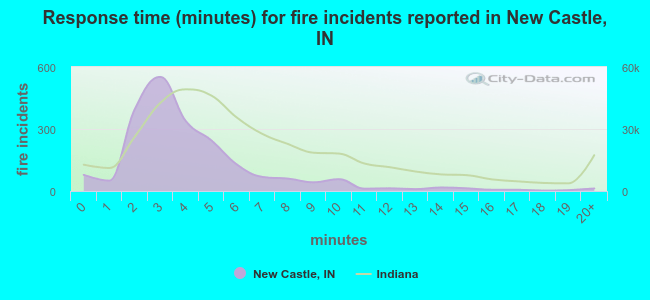 The median response time based on all reported fire incidents is 3 minutes. This is much lower than the Indiana median value.
The median response time in New Castle, IN compared to nearest cities:
(Note: Based on data for all years, including only cities with at least 500 fire incidents)
| New Castle: | 3 minutes |
| Middletown: | 6 minutes |
| Daleville: | 8 minutes |
| Chesterfield: | 8 minutes |
| Yorktown: | 9 minutes |
| Muncie: | 5 minutes |
| Anderson: | 7 minutes |
| Pendleton: | 8 minutes |
| Centerville: | 7 minutes |
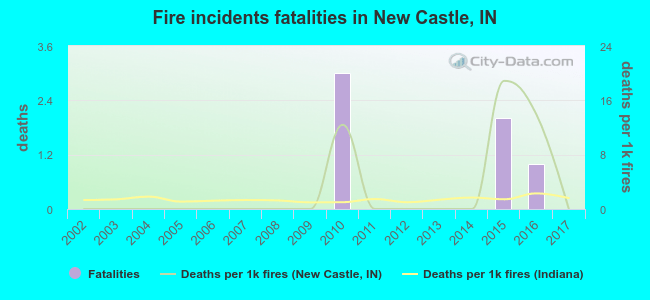 According to the data from the years 2002 - 2017 the average number of fire-related fatalities per year is 0. The highest number of reported deaths - 3 took place in 2010, and the lowest - 0 in 2002. The data has a constant trend.
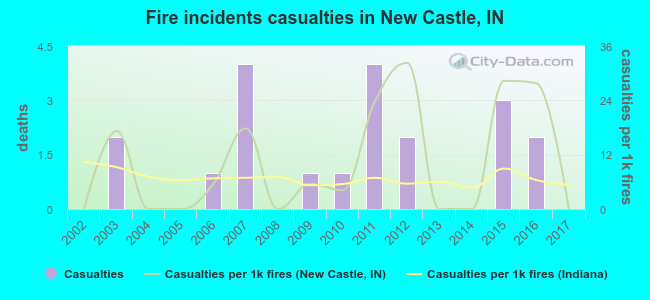 According to the reports from the years 2002 - 2017 the average number of fire-related yearly casualties is 1. The highest number of reported casualties - 4 took place in 2007, and the lowest - 0 in 2002. The data has a constant trend.
The average number of injuries per 1,000 fires is 10. This indicator was the highest - 32 in 2012, and the lowest 0 in 2002. The trend for injuries per 1,000 fire incidents is increasing. Compared to the Indiana value the number of casualties per 1,000 incidents is higher.
According to the reports from the years 2002 - 2017 the average number of fire-related yearly casualties is 1. The highest number of reported casualties - 4 took place in 2007, and the lowest - 0 in 2002. The data has a constant trend.
The average number of injuries per 1,000 fires is 10. This indicator was the highest - 32 in 2012, and the lowest 0 in 2002. The trend for injuries per 1,000 fire incidents is increasing. Compared to the Indiana value the number of casualties per 1,000 incidents is higher.Casualties per 1,000 incidents in New Castle, IN compared to nearest cities:
(Note: Based on data for all years, including only cities with at least 500 fire incidents)
| New Castle: | 9.5 |
| Middletown: | 1.9 |
| Daleville: | 21.3 |
| Chesterfield: | 5.6 |
| Yorktown: | 2.1 |
| Muncie: | 13.0 |
| Anderson: | 3.5 |
| Pendleton: | 1.7 |
| Centerville: | 5.1 |
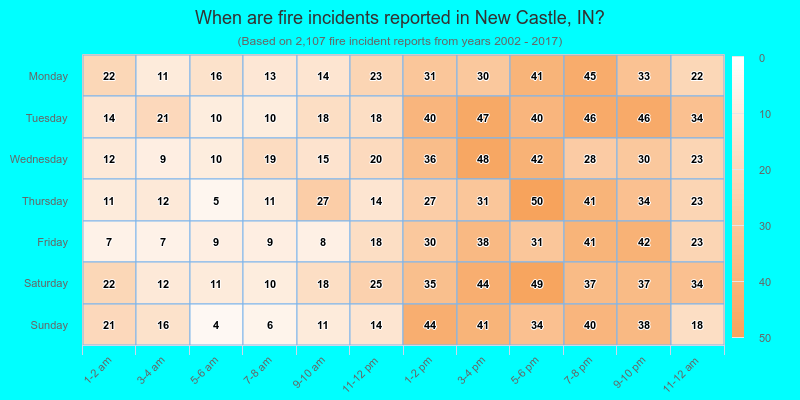
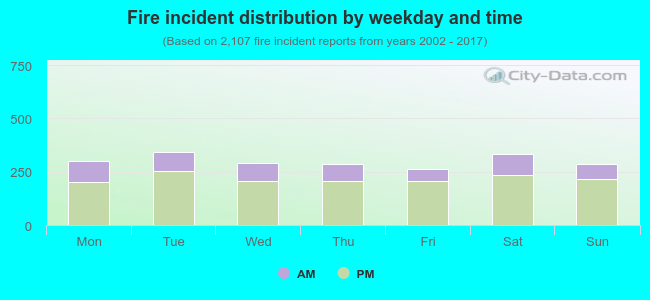 27.7% incidents where reported in the morning and 72.3% in the evening. The most fires (16.3%) took place on Tuesday, and the least (12.5%) on Friday.
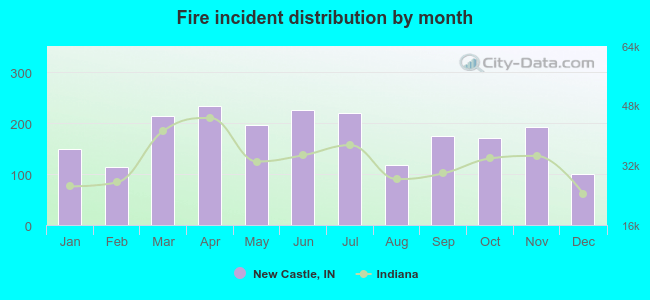 Based on the 2,107 fire incidents from years 2002 - 2017 most fires (11.1%) took place during April, and the least (4.7%) in December.
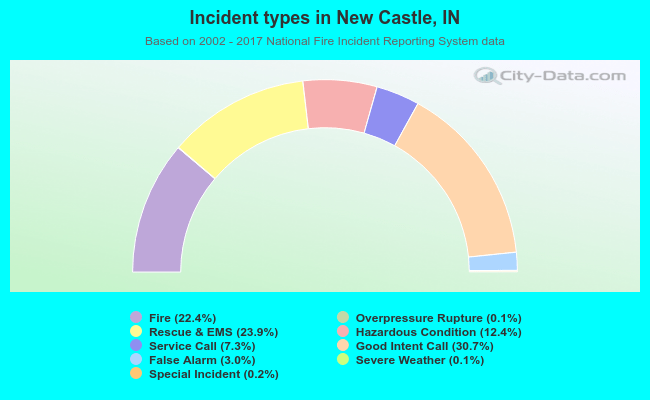 Out of all 9,425 cases reported during the years 2002 - 2017, the most belonged to the categories: Good Intent Call (30.7%), Rescue & EMS (23.9%), and Fire (22.4%).
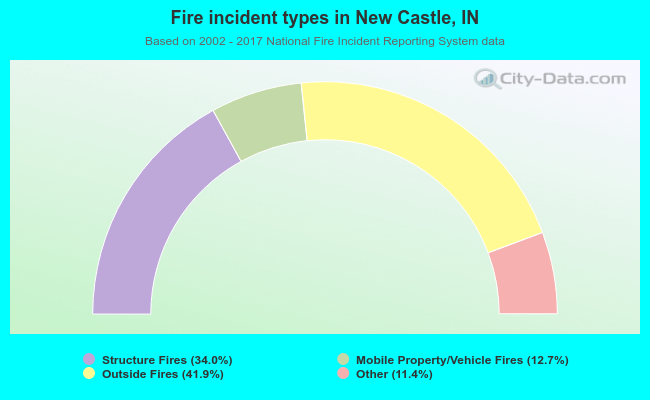 When looking into fire subcategories, the most reports belonged to: Outside Fires (41.9%), and Structure Fires (34.0%).