Milltown: Fire Incidents, New Jersey (NJ)
Where are fire incidents reported in Milltown, NJ
Something went wrong! Please refresh the page.
|
| |||||||||||||||||||||||||||||||||||||||||||||||||||||||||||||||||||||||||||||||||||||||||||||||||||||||||||||
2003 - 2018 National Fire Incident Reporting System (NFIRS) incidents
- Incident types reported to NFIRS in Milltown, NJ
- 66850.2%Hazardous Condition
- 26920.2%Fire
- 22216.7%False Alarm
- 715.3%Good Intent Call
- 614.6%Service Call
- 231.7%Rescue & EMS
- 110.8%Severe Weather
- 40.3%Special Incident
- 20.2%Overpressure Rupture
- Fire incident types reported to NFIRS in Milltown, NJ
- 11342.0%Structure Fires
- 8029.7%Outside Fires
- 6122.7%Mobile Property/Vehicle Fires
- 155.6%Other
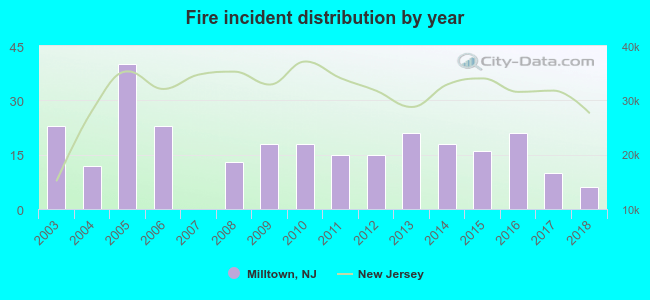 Based on the data from the years 2003 - 2018 the average number of fire incidents per year is 17. The highest number of fires - 40 took place in 2005, and the least - 0 in 2007. The data has a declining trend.
The average number of yearly fire incidents per 10k residents in Milltown, NJ compared to nearest cities:
(Note: Based on data for the last 3 years, including only cities with population 5,000 and above)
| Milltown: | 17.5 |
| East Brunswick: | 18.2 |
| New Brunswick: | 21.3 |
| South River: | 15.5 |
| Highland Park: | 19.4 |
| Somerset: | 43.2 |
| Spotswood: | 16.0 |
| Sayreville: | 11.2 |
| Dayton: | 16.0 |
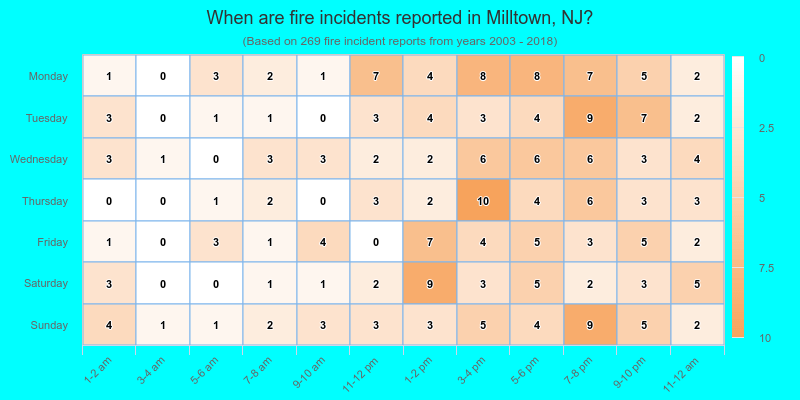
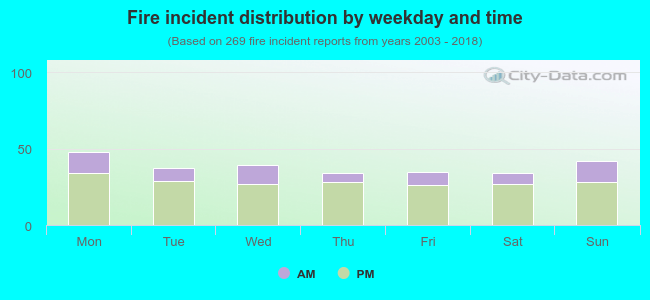 26.0% incidents where reported in the morning and 74.0% in the evening. The most fires (17.8%) took place on Monday, and the least (12.6%) on Thursday.
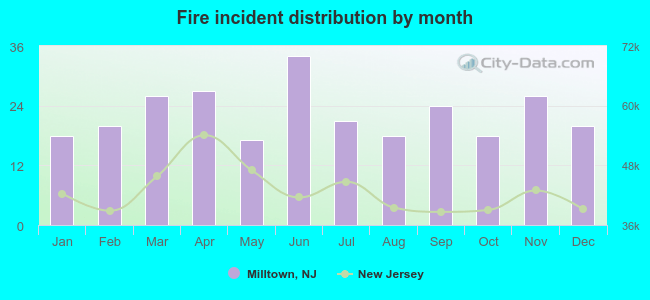 Based on the 269 incident reports from years 2003 - 2018 most fires (12.6%) took place during June, and the least (6.3%) in May.
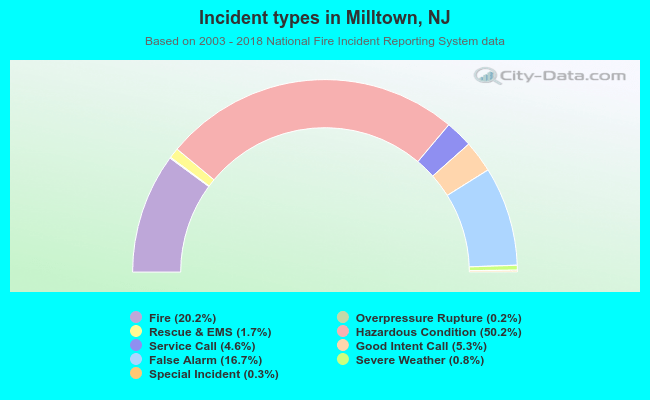 Out of all 1,331 cases reported during the years 2003 - 2018, the most belonged to the categories: Hazardous Condition (50.2%), Fire (20.2%), and False Alarm (16.7%).
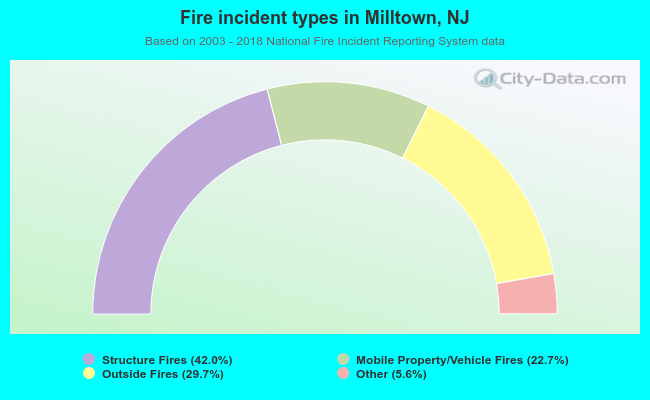 When looking into fire subcategories, the most incidents belonged to: Structure Fires (42.0%), and Outside Fires (29.7%).