South River: Fire Incidents, New Jersey (NJ)
Where are fire incidents reported in South River, NJ
Something went wrong! Please refresh the page.
|
| |||||||||||||||||||||||||||||||||||||||||||||||||||||||||||||||||||||||||||||||||||||||||||||||||||||||||||||
2004 - 2018 National Fire Incident Reporting System (NFIRS) incidents
- Incident types reported to NFIRS in South River, NJ
- 87835.8%False Alarm
- 57723.5%Hazardous Condition
- 46919.1%Fire
- 2439.9%Service Call
- 2158.8%Good Intent Call
- 331.3%Special Incident
- 281.1%Rescue & EMS
- 90.4%Severe Weather
- Fire incident types reported to NFIRS in South River, NJ
- 31066.1%Structure Fires
- 11825.2%Outside Fires
- 367.7%Mobile Property/Vehicle Fires
- 51.1%Other
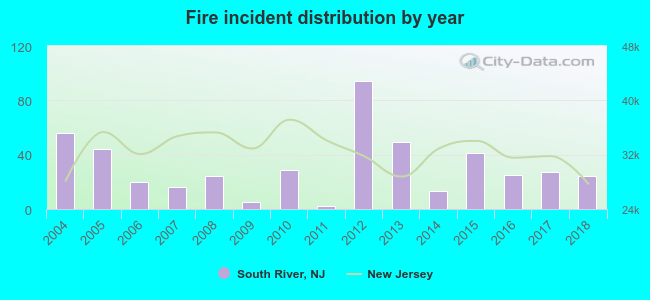 Based on the data from the years 2004 - 2018 the average number of fire incidents per year is 31. The highest number of reported fires - 94 took place in 2012, and the least - 2 in 2011. The data has a declining trend.
The average number of yearly fire incidents per 10k residents in South River, NJ compared to nearest cities:
(Note: Based on data for the last 3 years, including only cities with population 5,000 and above)
| South River: | 15.5 |
| East Brunswick: | 18.2 |
| Milltown: | 17.5 |
| Sayreville: | 11.2 |
| Spotswood: | 16.0 |
| Old Bridge: | 38.9 |
| Highland Park: | 19.4 |
| New Brunswick: | 21.3 |
| South Amboy: | 51.2 |
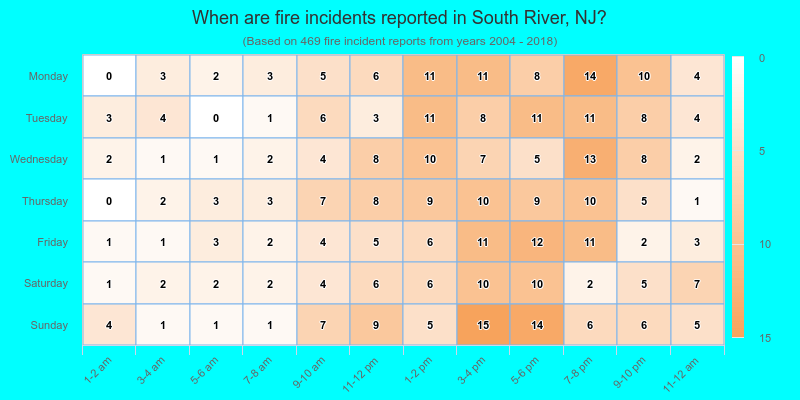
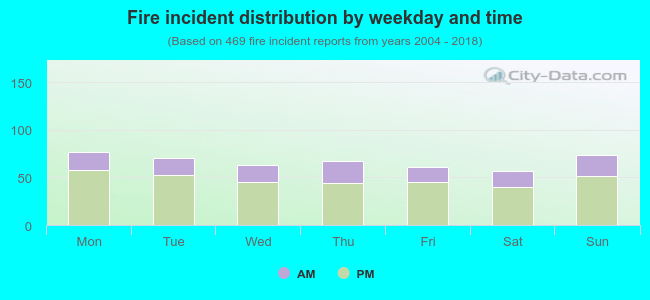 28.4% incidents where reported in the morning and 71.6% in the evening. The most fires (16.4%) took place on Monday, and the least (12.2%) on Saturday.
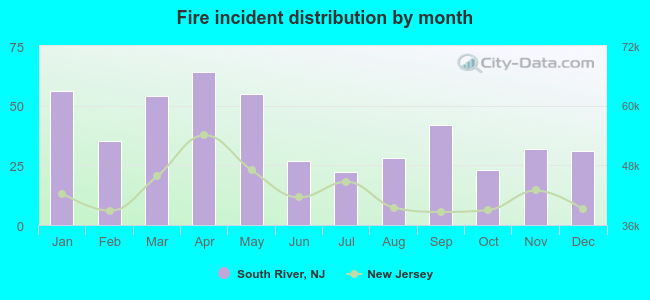 According to the 469 fires from years 2004 - 2018 most fires (13.6%) took place during April, and the least (4.7%) in July.
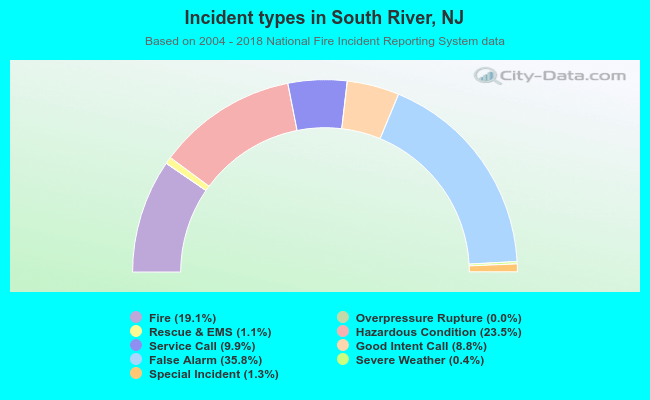 Out of all 2,453 cases reported during the years 2004 - 2018, the most belonged to the categories: False Alarm (35.8%), Hazardous Condition (23.5%), and Fire (19.1%).
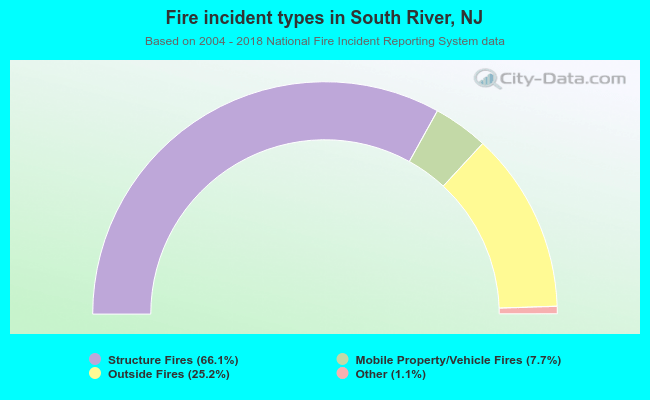 When looking into fire subcategories, the most incidents belonged to: Structure Fires (66.1%), and Outside Fires (25.2%).