| Fire incidents reported |
|---|
| Sreet name | Count |
|---|
| BROOK RD | 16 | | PURGATORY RD | 14 | | HORTON RD | 12 | | MAIN ST | 12 | | BEECH HILL RD | 10 | | OLD AMHERST RD | 10 | | WESTON HILL RD | 10 | | SPRING HILL RD | 8 | | TATER ST | 8 | | WESTGATE RD | 8 | | WILTON RD | 8 | | CROSS RD | 6 | | FRANCESTOWN TPK | 6 | | GAVIN RD | 6 | | LOVELLS WAY | 6 | | BLACK BROOK WAY | 4 | | BROOK ROAD | 4 | | FRANCESTOWN TPKE | 4 | | GRAND HILL RD | 4 | | KENDALL HILL RD | 4 | | LEVESQUE LN | 4 | | OLD MILFORD RD | 4 | | SECOMB RD | 4 | | SMITH RD | 4 | | UPTON RD | 4 |
| | | Fire incidents reported |
|---|
| Sreet name | Count |
|---|
| 3RD ST | 2 | | AMHERST RD | 2 | | BLACK BROOK DR | 2 | | BLACK BROOK WAY | 2 | | BLOOD RD | 2 | | BROOK RD | 2 | | CARTON RD | 2 | | CHRISTMAS TREE LN | 2 | | FOXBERRY | 2 | | GREGORY ST | 2 | | HAZEN RD | 2 | | JOE ENGLISH RD | 2 | | KITTREDGE RD | 2 | | LAMSON FARM RD | 2 | | LOVELLS RD | 2 | | LOVELLS WAY | 2 | | MAIN STREET | 2 | | MARGARET RD | 2 | | MARGARET WAY | 2 | | MOBILE COACH | 2 | | MOBILE COACH LN | 2 | | NORTH MAIN ST | 2 | | NORTH MAIN STREET | 2 | | OLD AMHERST | 2 | | OLD NEW BOSTON RD | 2 |
|
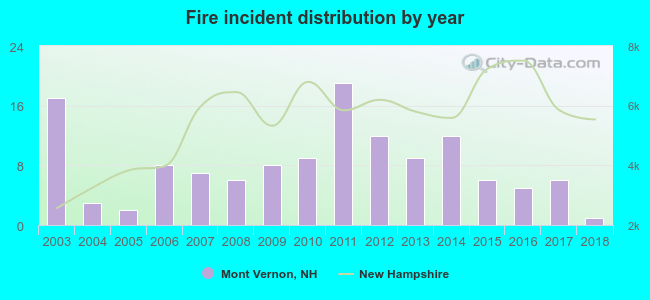 Based on the data from the years 2003 - 2018 the average number of fires per year is 8. The highest number of reported fire incidents - 19 took place in 2011, and the least - 1 in 2018. The data has a decreasing trend.
 32.3% incidents where reported in the morning and 67.7% in the evening. The most fires (17.7%) took place on Tuesday, and the least (9.2%) on Thursday.
 Based on the 130 fires from years 2003 - 2018 most fires (19.2%) took place during February, and the least (3.1%) in July.
 Out of all 665 cases reported during the years 2003 - 2018, the most belonged to the categories: Rescue & EMS (33.5%), Fire (19.5%), and Hazardous Condition (18.6%).
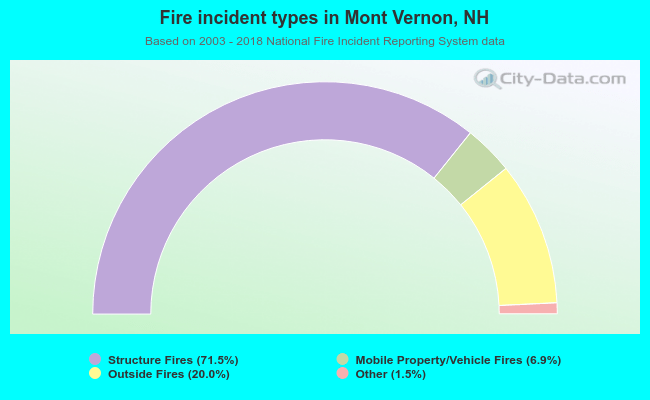 When looking into fire subcategories, the most reports belonged to: Structure Fires (71.5%), and Outside Fires (20.0%).