Mount Carmel: Fire Incidents, Tennessee (TN)
Where are fire incidents reported in Mount Carmel, TN
Something went wrong! Please refresh the page.
|
| |||||||||||||||||||||||||||||||||||||||||||||||||||||||||||||||||||||||||||||||||||||||||||||||||||||||||||||
2002 - 2018 National Fire Incident Reporting System (NFIRS) incidents
- Incident types reported to NFIRS in Mount Carmel, TN
- 24341.1%Fire
- 16928.6%Hazardous Condition
- 6511.0%Rescue & EMS
- 386.4%Service Call
- 355.9%False Alarm
- 325.4%Good Intent Call
- 81.4%Special Incident
- 10.2%Severe Weather
- Fire incident types reported to NFIRS in Mount Carmel, TN
- 10744.0%Structure Fires
- 7631.3%Outside Fires
- 3112.8%Mobile Property/Vehicle Fires
- 2911.9%Other
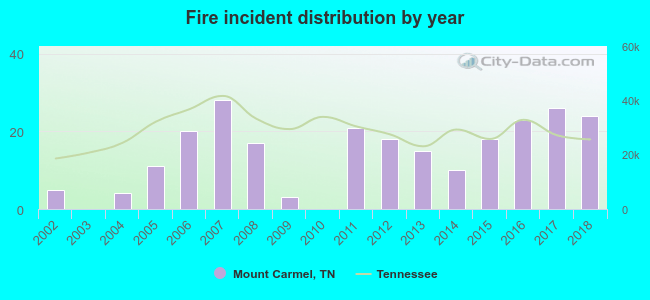 Based on the data from the years 2002 - 2018 the average number of fires per year is 14. The highest number of fire incidents - 28 took place in 2007, and the least - 0 in 2003. The data has an increasing trend.
The average number of yearly fire incidents per 10k residents in Mount Carmel, TN compared to nearest cities:
(Note: Based on data for the last 3 years, including only cities with population 5,000 and above)
| Mount Carmel: | 44.6 |
| Church Hill: | 52.3 |
| Kingsport: | 67.3 |
| Bloomingdale: | 1.0 |
| Colonial Heights: | 2.2 |
| Jonesborough: | 178.8 |
| Johnson City: | 41.4 |
| Telford: | 10.5 |
| Bristol: | 54.5 |

 32.1% incidents where reported in the morning and 67.9% in the evening. The most fires (15.2%) took place on Monday, and the least (11.9%) on Tuesday.
 According to the 243 fires from years 2002 - 2018 most fires (14.0%) took place during May, and the least (2.5%) in August.
 Out of all 591 cases reported during the years 2002 - 2018, the most belonged to the categories: Fire (41.1%), Rescue & EMS (28.6%), and Overpressure Rupture (11.0%).
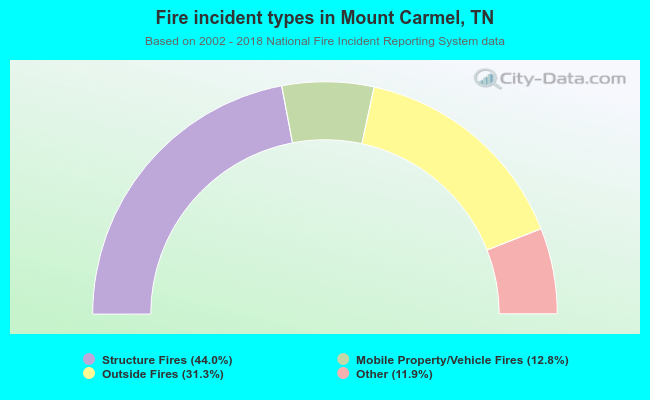 When looking into fire subcategories, the most incidents belonged to: Structure Fires (44.0%), and Outside Fires (31.3%).