Church Hill: Fire Incidents, Tennessee (TN)
Where are fire incidents reported in Church Hill, TN
Something went wrong! Please refresh the page.
|
| |||||||||||||||||||||||||||||||||||||||||||||||||||||||||||||||||||||||||||||||||||||||||||||||||||||||||||||
| Other | 267 | |||||||||||||||||||||||||||||||||||||||||||||||||||||||||||||||||||||||||||||||||||||||||||||||||||||||||||||
2002 - 2018 National Fire Incident Reporting System (NFIRS) incidents
- Incident types reported to NFIRS in Church Hill, TN
- 71338.0%Fire
- 69136.8%Hazardous Condition
- 20711.0%Rescue & EMS
- 1045.5%Good Intent Call
- 713.8%False Alarm
- 703.7%Service Call
- 100.5%Special Incident
- 80.4%Severe Weather
- 30.2%Overpressure Rupture
- Fire incident types reported to NFIRS in Church Hill, TN
- 31744.5%Structure Fires
- 23733.2%Outside Fires
- 10414.6%Mobile Property/Vehicle Fires
- 557.7%Other
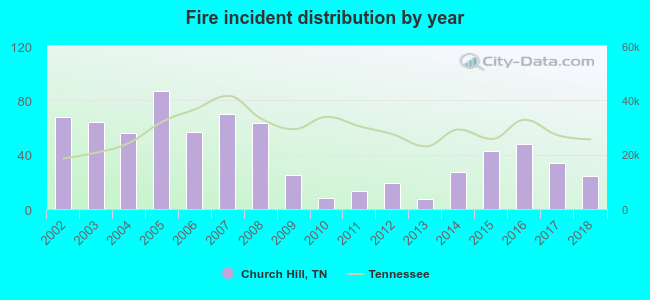 According to the data from the years 2002 - 2018 the average number of fire incidents per year is 42. The highest number of fires - 87 took place in 2005, and the least - 7 in 2013. The data has a decreasing trend.
The average number of yearly fire incidents per 10k residents in Church Hill, TN compared to nearest cities:
(Note: Based on data for the last 3 years, including only cities with population 5,000 and above)
| Church Hill: | 52.3 |
| Mount Carmel: | 44.6 |
| Kingsport: | 67.3 |
| Colonial Heights: | 2.2 |
| Bloomingdale: | 1.0 |
| Jonesborough: | 178.8 |
| Telford: | 10.5 |
| Johnson City: | 41.4 |
| Greeneville: | 133.0 |
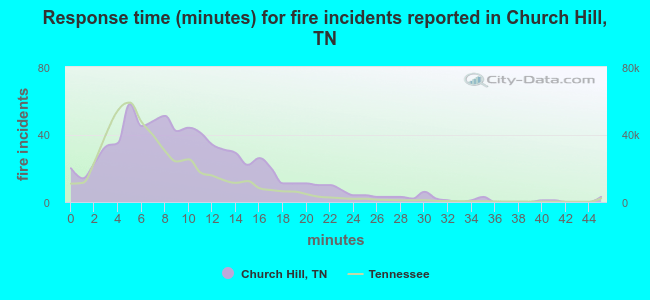 The median response time based on all reported fire incidents is 9 minutes. This is higher than the state median value.
The median response time in Church Hill, TN compared to nearest cities:
(Note: Based on data for all years, including only cities with at least 500 fire incidents)
| Church Hill: | 9 minutes |
| Kingsport: | 7 minutes |
| Gray: | 10 minutes |
| Rogersville: | 10 minutes |
| Jonesborough: | 9 minutes |
| Blountville: | 11 minutes |
| Johnson City: | 4 minutes |
| Greeneville: | 8 minutes |
| Bluff City: | 8 minutes |
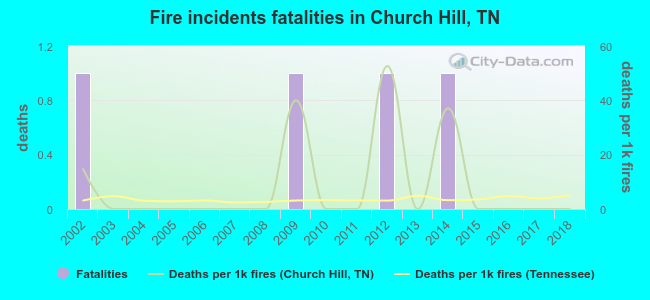 Based on the reports from the years 2002 - 2018 the average number of fire-related fatalities per year is 0. The highest number of reported deaths - 1 took place in 2002, and the lowest - 0 in 2003. The data has a declining trend.
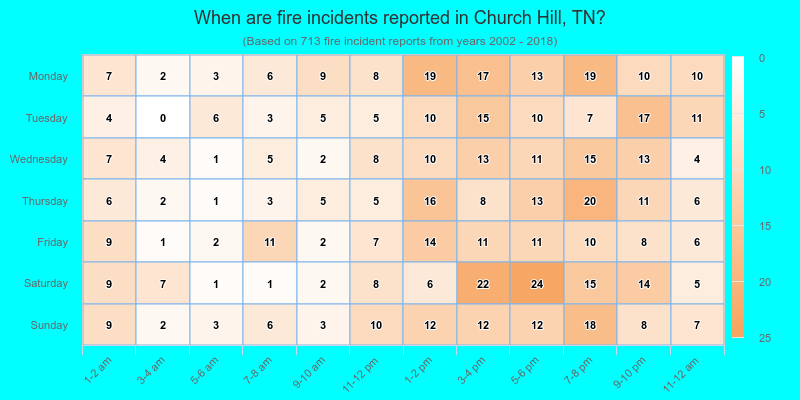
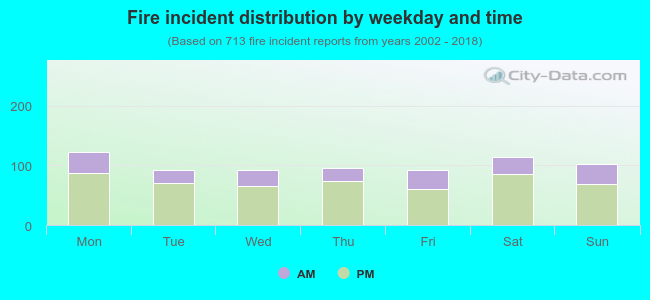 28.1% incidents where reported in the morning and 71.9% in the evening. The most fires (17.3%) took place on Monday, and the least (12.9%) on Friday.
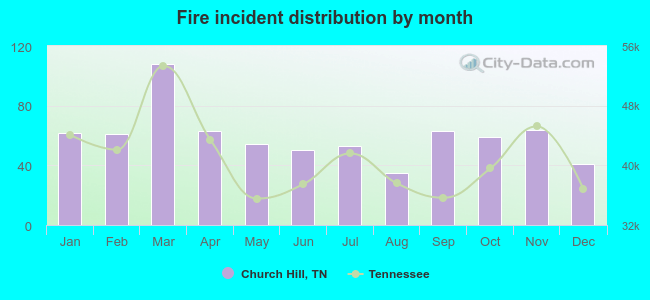 Based on the 713 fires from years 2002 - 2018 most fires (15.1%) took place during March, and the least (4.9%) in August.
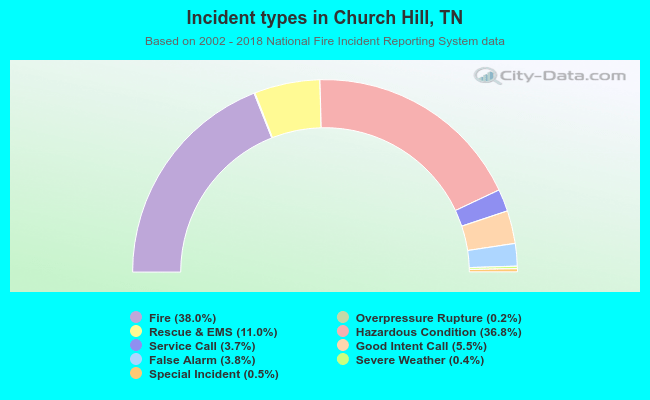 Out of all 1,877 cases reported during the years 2002 - 2018, the most belonged to the categories: Fire (38.0%), Hazardous Condition (36.8%), and Rescue & EMS (11.0%).
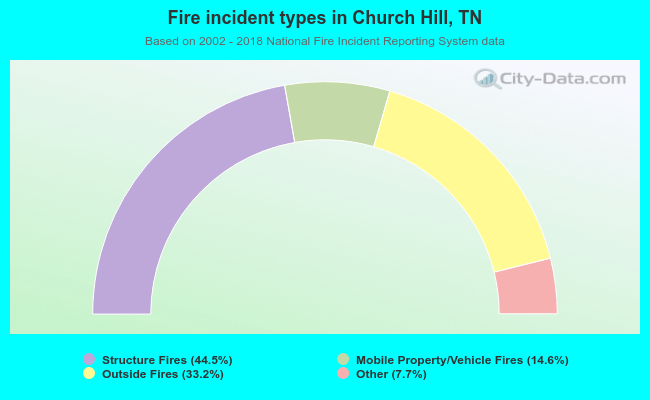 When looking into fire subcategories, the most reports belonged to: Structure Fires (44.5%), and Outside Fires (33.2%).