Mount Pleasant: Fire Incidents, South Carolina (SC)
Where are fire incidents reported in Mount Pleasant, SC
Something went wrong! Please refresh the page.
| Fire incidents reported | |
|---|---|
| Sreet name | Count |
| HIGHWAY 17 NORTH | 120 |
| JOHNNIE DODDS BLVD | 110 |
| RIFLE RANGE RD | 74 |
| COLEMAN BLVD | 50 |
| HIGHWAY 17 HWY | 44 |
| LONGPOINT RD | 36 |
| BOWMAN RD | 34 |
| SIX MILE RD | 32 |
| LONG POINT RD | 30 |
| BEN SAWYER BLVD | 28 |
| HIGHWAY 41 HWY | 28 |
| HAMLIN RD | 22 |
| HIGHWAY 41 | 22 |
| VENNING RD | 22 |
| EGYPT RD | 20 |
| MATHIS FERRY RD | 20 |
| HOUSTON NORTHCUTT BLVD | 18 |
| ANNA KNAPP BLVD | 16 |
| PARK WEST BLVD | 16 |
| SNOWDEN RD | 16 |
| BOSTON GRILL RD | 14 |
| CENTER STREET EXT | 14 |
| CHUCK DAWLEY BLVD | 14 |
| ISLAND VIEW DR | 14 |
| 7TH AVE | 12 |
| BOBO RD | 12 |
| HIGHWAY 17 | 12 |
| LONG GROVE DR | 12 |
| WEAVER CIR | 12 |
| WHIPPLE RD | 12 |
| Other | 524 |
2003 - 2018 National Fire Incident Reporting System (NFIRS) incidents
- Incident types reported to NFIRS in Mount Pleasant, SC
- 1,41026.4%Fire
- 1,31524.6%Rescue & EMS
- 1,22122.8%Hazardous Condition
- 90316.9%Good Intent Call
- 2514.7%Service Call
- 2244.2%False Alarm
- 100.2%Special Incident
- 80.1%Severe Weather
- 70.1%Overpressure Rupture
- Fire incident types reported to NFIRS in Mount Pleasant, SC
- 60142.6%Outside Fires
- 58641.6%Structure Fires
- 19113.5%Mobile Property/Vehicle Fires
- 322.3%Other
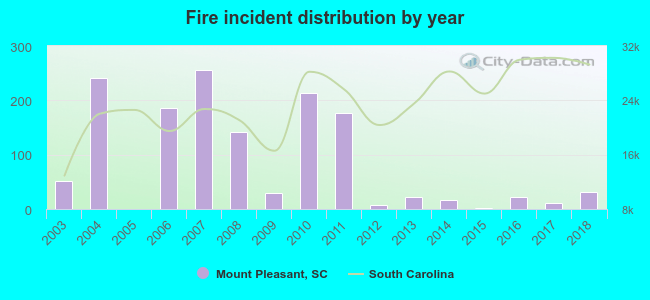 Based on the data from the years 2003 - 2018 the average number of fires per year is 88. The highest number of fire incidents - 256 took place in 2007, and the least - 0 in 2005. The data has a dropping trend.
The average number of yearly fire incidents per 10k residents in Mount Pleasant, SC compared to nearest cities:
(Note: Based on data for the last 3 years, including only cities with population 5,000 and above)
| Mount Pleasant: | 2.8 |
| Charleston: | 56.7 |
| James Island: | 12.7 |
| Wando: | 18.9 |
| North Charleston: | 73.9 |
| Hanahan: | 29.4 |
| Johns Island: | 104.5 |
| Goose Creek: | 39.1 |
| Ladson: | 102.5 |
 The median response time based on all reported fire incidents is 6 minutes. This is about the same as the South Carolina median value.
The median response time in Mount Pleasant, SC compared to nearest cities:
(Note: Based on data for all years, including only cities with at least 500 fire incidents)
| Mount Pleasant: | 6 minutes |
| Charleston: | 4 minutes |
| North Charleston: | 5 minutes |
| Johns Island: | 7 minutes |
| Goose Creek: | 5 minutes |
| Ladson: | 5 minutes |
| Hollywood: | 5 minutes |
| Summerville: | 6 minutes |
| Moncks Corner: | 5 minutes |
 Based on the reports from the years 2003 - 2018 the average number of fire-related yearly casualties is 2. The highest number of injuries - 8 took place in 2006, and the lowest - 0 in 2005. The data has a declining trend.
The average number of casualties per 1,000 fires is 18. This indicator was the highest - 91 in 2013, and the lowest 0 in 2005. The trend for casualties per 1,000 fire incidents is dropping. Compared to the South Carolina value the number of casualties per 1,000 fire incidents is much higher.
Based on the reports from the years 2003 - 2018 the average number of fire-related yearly casualties is 2. The highest number of injuries - 8 took place in 2006, and the lowest - 0 in 2005. The data has a declining trend.
The average number of casualties per 1,000 fires is 18. This indicator was the highest - 91 in 2013, and the lowest 0 in 2005. The trend for casualties per 1,000 fire incidents is dropping. Compared to the South Carolina value the number of casualties per 1,000 fire incidents is much higher.Casualties per 1,000 incidents in Mount Pleasant, SC compared to nearest cities:
(Note: Based on data for all years, including only cities with at least 500 fire incidents)
| Mount Pleasant: | 18.4 |
| Charleston: | 7.7 |
| North Charleston: | 25.2 |
| Johns Island: | 9.4 |
| Goose Creek: | 13.3 |
| Ladson: | 2.1 |
| Hollywood: | 0.0 |
| Summerville: | 7.6 |
| Moncks Corner: | 3.3 |
 26.9% incidents where reported in the morning and 73.1% in the evening. The most fires (18.1%) took place on Saturday, and the least (11.9%) on Wednesday.
 Based on the 1,410 fire incident reports from years 2003 - 2018 most fires (13.7%) took place during January, and the least (4.5%) in September.
 Out of all 5,349 cases reported during the years 2003 - 2018, the most belonged to the categories: Fire (26.4%), Rescue & EMS (24.6%), and Hazardous Condition (22.8%).
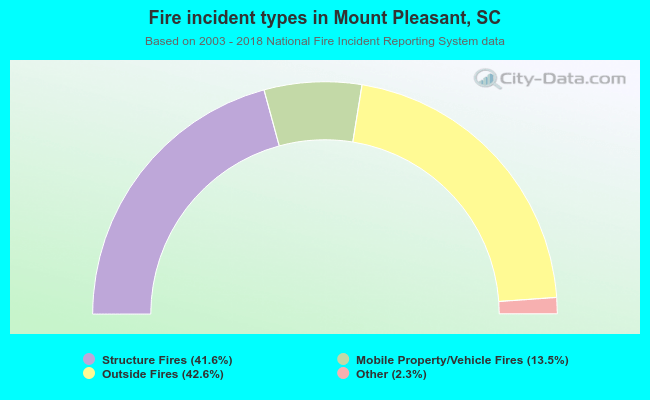 When looking into fire subcategories, the most incidents belonged to: Outside Fires (42.6%), and Structure Fires (41.6%).