Summerville: Fire Incidents, South Carolina (SC)
Where are fire incidents reported in Summerville, SC
Something went wrong! Please refresh the page.
| Fire incidents reported | |
|---|---|
| Sreet name | Count |
| ORANGEBURG RD | 262 |
| MAIN ST | 224 |
| DORCHESTER RD | 210 |
| CENTRAL AVE | 190 |
| BACONS BRIDGE RD | 144 |
| TROLLEY RD | 140 |
| COLLEGE PARK RD | 102 |
| MAPLE ST | 94 |
| BOONEHILL RD | 90 |
| SHEEP ISLAND RD | 74 |
| I26 | 64 |
| ROYLE RD | 64 |
| FIFTH ST | 62 |
| FIFTH NORTH ST | 60 |
| JEDBURG RD | 60 |
| BRALY DR | 54 |
| INTERSTATE 26 | 52 |
| BOONE HILL RD | 50 |
| GREYBACK RD | 46 |
| HIGHWAY 17-A | 46 |
| OLD TROLLEY RD | 46 |
| BEECH HILL RD | 44 |
| BUTTERNUT RD | 42 |
| LADSON RD | 42 |
| MAIN 1000 1900 BLK ST | 42 |
| STATE RD | 42 |
| ASHLEY RIVER RD | 38 |
| MILES RD | 38 |
| RENAU BLVD | 38 |
| SPRINGVIEW LN | 38 |
| Other | 2,788 |
2003 - 2018 National Fire Incident Reporting System (NFIRS) incidents
- Incident types reported to NFIRS in Summerville, SC
- 20,73754.1%Rescue & EMS
- 5,28613.8%Fire
- 4,62112.1%Good Intent Call
- 3,3998.9%False Alarm
- 2,0875.4%Service Call
- 1,8524.8%Hazardous Condition
- 1730.5%Special Incident
- 1110.3%Severe Weather
- 400.1%Overpressure Rupture
- Fire incident types reported to NFIRS in Summerville, SC
- 2,19241.5%Outside Fires
- 2,05738.9%Structure Fires
- 85816.2%Mobile Property/Vehicle Fires
- 1793.4%Other
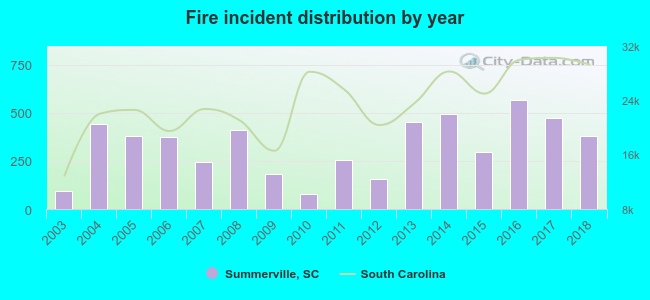 Based on the data from the years 2003 - 2018 the average number of fire incidents per year is 330. The highest number of reported fire incidents - 565 took place in 2016, and the least - 77 in 2010. The data has an increasing trend.
The average number of yearly fire incidents per 10k residents in Summerville, SC compared to nearest cities:
(Note: Based on data for the last 3 years, including only cities with population 5,000 and above)
| Summerville: | 100.5 |
| Ladson: | 102.5 |
| Goose Creek: | 39.1 |
| Hanahan: | 29.4 |
| North Charleston: | 73.9 |
| Moncks Corner: | 313.6 |
| Cross: | 83.7 |
| Wando: | 18.9 |
| Charleston: | 56.7 |
 The median response time based on all reported fire incidents is 6 minutes. This is close to the South Carolina median value.
The median response time in Summerville, SC compared to nearest cities:
(Note: Based on data for all years, including only cities with at least 500 fire incidents)
| Summerville: | 6 minutes |
| Ladson: | 5 minutes |
| Goose Creek: | 5 minutes |
| Ridgeville: | 9 minutes |
| North Charleston: | 5 minutes |
| Moncks Corner: | 5 minutes |
| Cross: | 12 minutes |
| Cottageville: | 9 minutes |
| Hollywood: | 5 minutes |
 According to the reports from the years 2003 - 2018 the average number of fire-related fatalities per year is 0. The highest number of reported deaths - 2 took place in 2008, and the lowest - 0 in 2003. The data has a constant trend.
The average number of fatalities per 1,000 fire incidents is 1. This indicator was the highest - 5 in 2008, and the lowest 0 in 2003. The trend for deaths per 1,000 fires is decreasing. Compared to the South Carolina value the number of deaths per 1,000 fire incidents is much lower.
According to the reports from the years 2003 - 2018 the average number of fire-related fatalities per year is 0. The highest number of reported deaths - 2 took place in 2008, and the lowest - 0 in 2003. The data has a constant trend.
The average number of fatalities per 1,000 fire incidents is 1. This indicator was the highest - 5 in 2008, and the lowest 0 in 2003. The trend for deaths per 1,000 fires is decreasing. Compared to the South Carolina value the number of deaths per 1,000 fire incidents is much lower.Deaths per 1,000 incidents in Summerville, SC compared to nearest cities:
(Note: Based on data for all years, including only cities with at least 2,500 fire incidents)
| Summerville: | 1.1 |
| North Charleston: | 2.7 |
| Moncks Corner: | 2.0 |
| Charleston: | 1.3 |
| Walterboro: | 2.1 |
| Manning: | 0.0 |
| Orangeburg: | 2.0 |
 Based on the data from the years 2003 - 2018 the average number of fire-related casualties per year is 3. The highest number of casualties - 9 took place in 2017, and the lowest - 0 in 2003. The data has an increasing trend.
The average number of injuries per 1,000 fires is 8. This indicator was the highest - 19 in 2017, and the lowest 0 in 2003. The trend for casualties per 1,000 fire incidents is rising. Compared to the state value the number of casualties per 1,000 fires is about the same.
Based on the data from the years 2003 - 2018 the average number of fire-related casualties per year is 3. The highest number of casualties - 9 took place in 2017, and the lowest - 0 in 2003. The data has an increasing trend.
The average number of injuries per 1,000 fires is 8. This indicator was the highest - 19 in 2017, and the lowest 0 in 2003. The trend for casualties per 1,000 fire incidents is rising. Compared to the state value the number of casualties per 1,000 fires is about the same.Casualties per 1,000 incidents in Summerville, SC compared to nearest cities:
(Note: Based on data for all years, including only cities with at least 500 fire incidents)
| Summerville: | 7.6 |
| Ladson: | 2.1 |
| Goose Creek: | 13.3 |
| Ridgeville: | 0.0 |
| North Charleston: | 25.2 |
| Moncks Corner: | 3.3 |
| Cross: | 1.5 |
| Cottageville: | 22.5 |
| Hollywood: | 0.0 |
 27.9% incidents where reported in the morning and 72.1% in the evening. The most fires (15.2%) took place on Saturday, and the least (13.7%) on Friday.
 Based on the 5,286 fire incident reports from years 2003 - 2018 most fires (12.9%) took place during March, and the least (5.9%) in November.
 Out of all 38,306 cases reported during the years 2003 - 2018, the most belonged to the categories: Rescue & EMS (54.1%), Fire (13.8%), and Good Intent Call (12.1%).
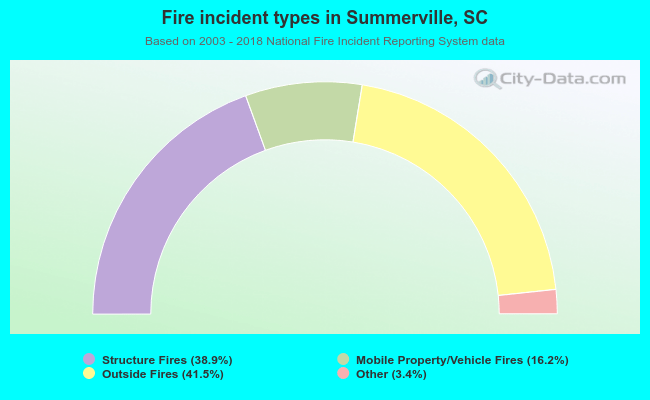 When looking into fire subcategories, the most reports belonged to: Outside Fires (41.5%), and Structure Fires (38.9%).