Mount Sinai: Fire Incidents, New York (NY)
Where are fire incidents reported in Mount Sinai, NY
Something went wrong! Please refresh the page.
|
| |||||||||||||||||||||||||||||||||||||||||||||||||||||||||||||||||||||||||||||||||||||||||||||||||||||||||||||
2003 - 2018 National Fire Incident Reporting System (NFIRS) incidents
- Incident types reported to NFIRS in Mount Sinai, NY
- 64230.6%Hazardous Condition
- 60829.0%False Alarm
- 34216.3%Fire
- 28613.6%Rescue & EMS
- 1256.0%Service Call
- 924.4%Good Intent Call
- Fire incident types reported to NFIRS in Mount Sinai, NY
- 13639.8%Structure Fires
- 13238.6%Outside Fires
- 4914.3%Mobile Property/Vehicle Fires
- 257.3%Other
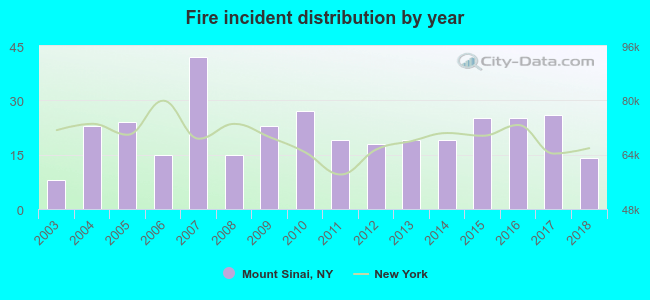 Based on the data from the years 2003 - 2018 the average number of fire incidents per year is 21. The highest number of reported fires - 42 took place in 2007, and the least - 8 in 2003. The data has a rising trend.
The average number of yearly fire incidents per 10k residents in Mount Sinai, NY compared to nearest cities:
(Note: Based on data for the last 3 years, including only cities with population 5,000 and above)
| Mount Sinai: | 17.9 |
| Miller Place: | 19.5 |
| Port Jefferson: | 22.5 |
| Terryville: | 1.7 |
| Sound Beach: | 28.0 |
| Coram: | 17.3 |
| Rocky Point: | 30.2 |
| Selden: | 31.9 |
| Middle Island: | 38.8 |
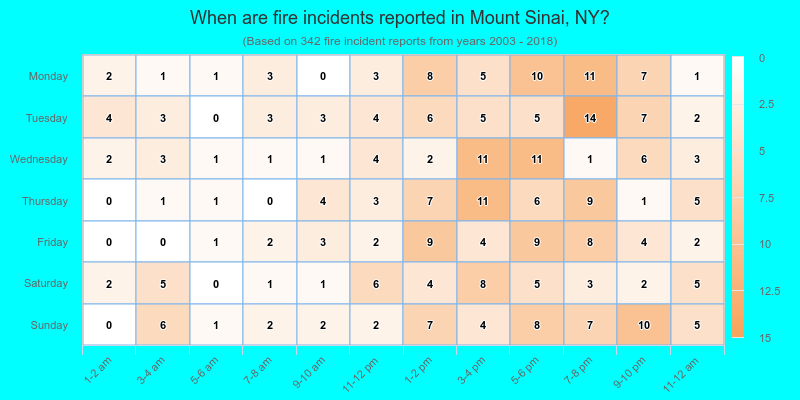
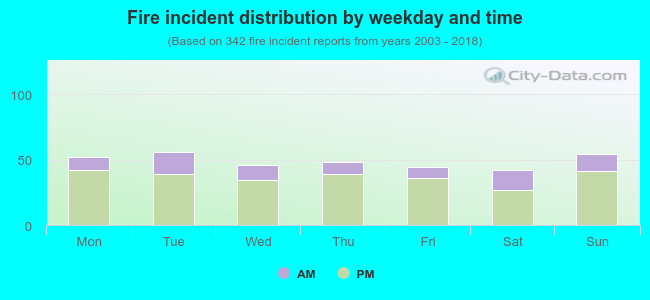 24.6% incidents where reported in the morning and 75.4% in the evening. The most fires (16.4%) took place on Tuesday, and the least (12.3%) on Saturday.
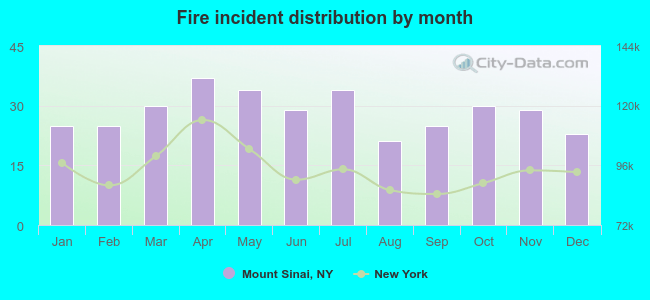 Based on the 342 fire incidents from years 2003 - 2018 most fires (10.8%) took place during April, and the least (6.1%) in August.
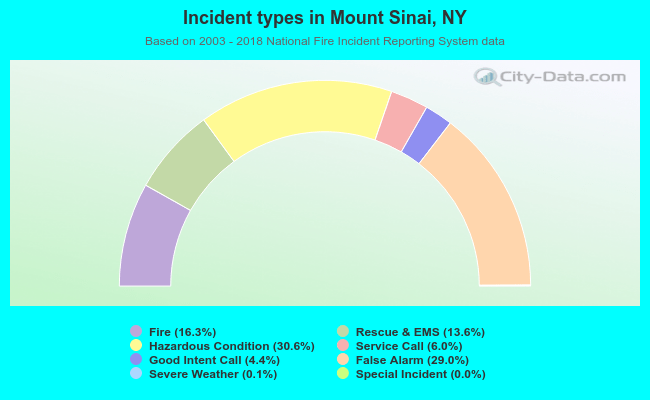 Out of all 2,098 cases reported during the years 2003 - 2018, the most belonged to the categories: Rescue & EMS (30.6%), Good Intent Call (29.0%), and Fire (16.3%).
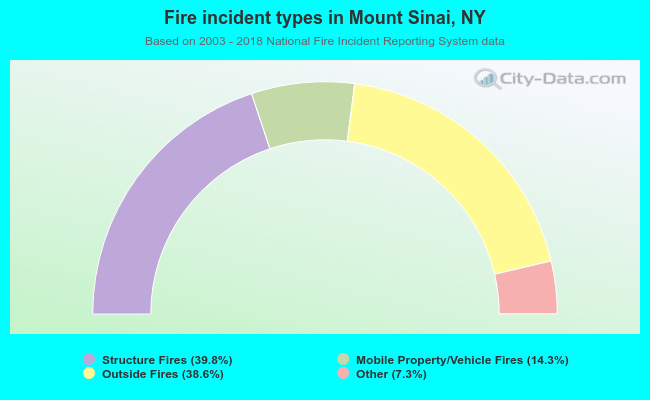 When looking into fire subcategories, the most incidents belonged to: Structure Fires (39.8%), and Outside Fires (38.6%).