Selden: Fire Incidents, New York (NY)
Where are fire incidents reported in Selden, NY
Something went wrong! Please refresh the page.
| Fire incidents reported | |
|---|---|
| Sreet name | Count |
| MIDDLE COUNTRY RD | 182 |
| BOYLE RD | 108 |
| COLLEGE RD | 100 |
| HAWKINS RD | 82 |
| DARE RD | 44 |
| SELDEN FIRE DEPT | 40 |
| SELDEN FIRE DEPT. | 38 |
| ADIRONDACK DR | 32 |
| MAGNOLIA DR | 32 |
| COLLEGE PLAZA | 30 |
| NORTH EVERGREEN DR | 28 |
| RULAND RD | 26 |
| MOONEY POND RD | 24 |
| RIVIERA DR | 24 |
| BLUE POINT RD | 20 |
| INDEPENDENCE PLAZA | 20 |
| SOUTH EVERGREEN DR | 18 |
| CR 83 | 16 |
| MIDDLE COUNTRY ROAD | 16 |
| IROQUOIS AV | 12 |
| MARSHALL DR | 12 |
| OAKMONT AV | 12 |
| WOODMERE PL | 12 |
| ANNE DR | 10 |
| BANK ST | 10 |
| CHARTER RD | 10 |
| COUNTY ROAD 83 | 10 |
| ELMWOOD AV | 10 |
| FAIRLANE DR | 10 |
| FERNDALE AV | 10 |
2006 - 2018 National Fire Incident Reporting System (NFIRS) incidents
- Incident types reported to NFIRS in Selden, NY
- 8,83268.7%Rescue & EMS
- 1,0958.5%False Alarm
- 9387.3%Fire
- 8906.9%Hazardous Condition
- 6695.2%Good Intent Call
- 3923.0%Service Call
- 240.2%Special Incident
- Fire incident types reported to NFIRS in Selden, NY
- 47851.0%Structure Fires
- 34636.9%Outside Fires
- 899.5%Mobile Property/Vehicle Fires
- 252.7%Other
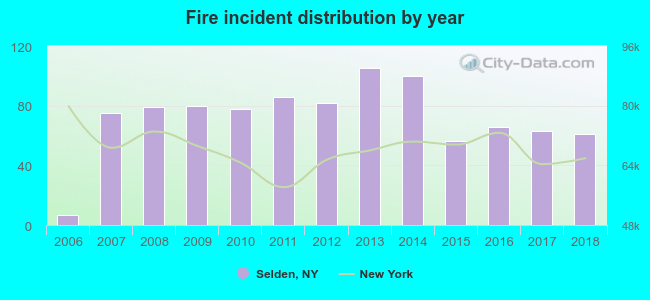 Based on the data from the years 2006 - 2018 the average number of fire incidents per year is 72. The highest number of reported fire incidents - 105 took place in 2013, and the least - 7 in 2006. The data has a growing trend.
The average number of yearly fire incidents per 10k residents in Selden, NY compared to nearest cities:
(Note: Based on data for the last 3 years, including only cities with population 5,000 and above)
| Selden: | 31.9 |
| Centereach: | 9.9 |
| Farmingville: | 26.1 |
| Coram: | 17.3 |
| Terryville: | 1.7 |
| Lake Grove: | 10.4 |
| Holtsville: | 9.6 |
| Lake Ronkonkoma: | 1.0 |
| Medford: | 37.3 |
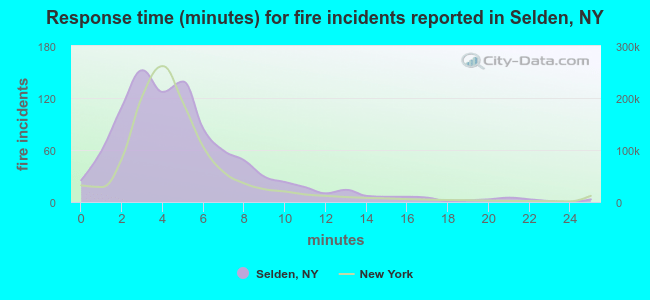 The median response time based on all reported fire incidents is 4 minutes. This is similar to the New York median value.
The median response time in Selden, NY compared to nearest cities:
(Note: Based on data for all years, including only cities with at least 500 fire incidents)
| Selden: | 4 minutes |
| Coram: | 6 minutes |
| Medford: | 4 minutes |
| Holbrook: | 4 minutes |
| Middle Island: | 7 minutes |
| Ronkonkoma: | 6 minutes |
| Miller Place: | 7 minutes |
| Patchogue: | 4 minutes |
| Bohemia: | 4 minutes |
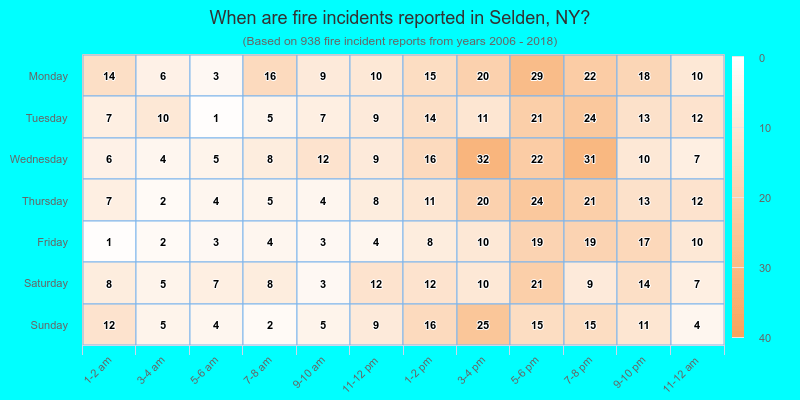
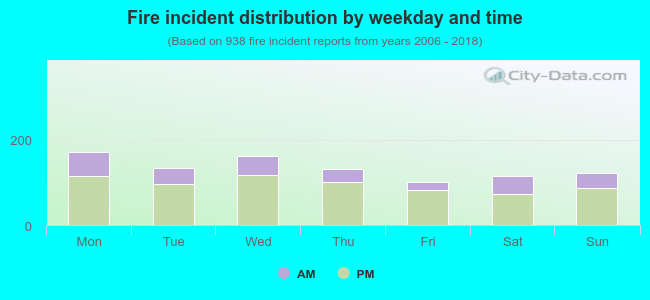 28.6% incidents where reported in the morning and 71.4% in the evening. The most fires (18.3%) took place on Monday, and the least (10.7%) on Friday.
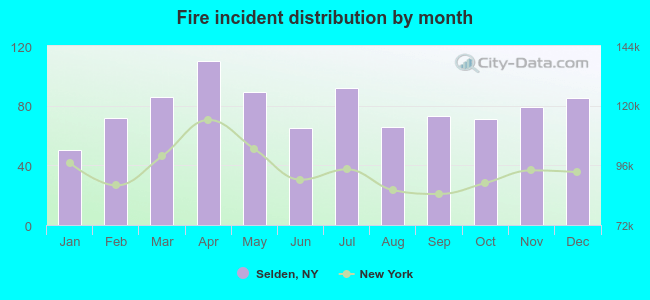 Based on the 938 incident reports from years 2006 - 2018 most fires (11.7%) took place during April, and the least (5.3%) in January.
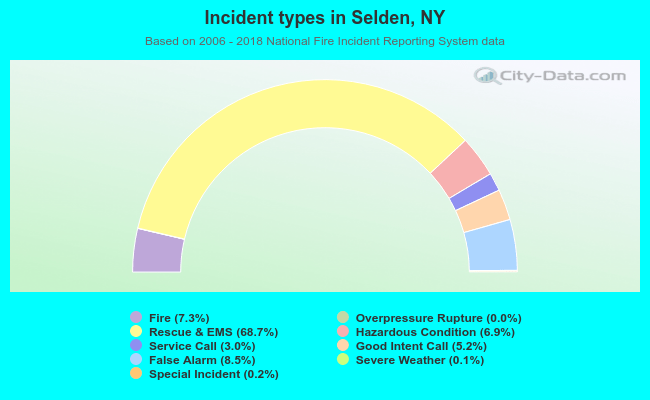 Out of all 12,856 cases reported during the years 2006 - 2018, the most belonged to the categories: Rescue & EMS (68.7%), False Alarm (8.5%), and Fire (7.3%).
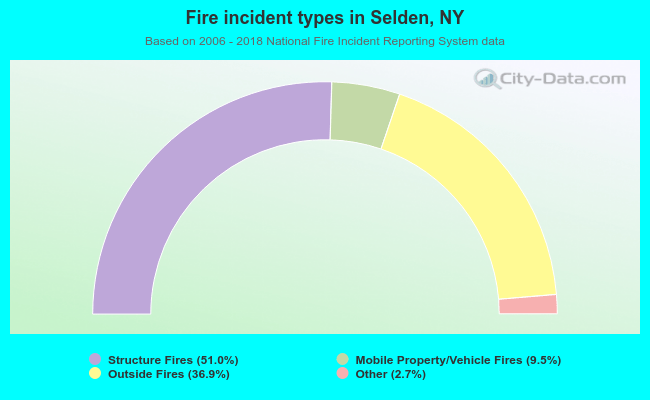 When looking into fire subcategories, the most reports belonged to: Structure Fires (51.0%), and Outside Fires (36.9%).