New Durham: Fire Incidents, New Hampshire (NH)
Where are fire incidents reported in New Durham, NH
Something went wrong! Please refresh the page.
|
| |||||||||||||||||||||||||||||||||||||||||||||||||||||||||||||||||||||||||||||||||||||||||||||||||||||||||||||
2002 - 2018 National Fire Incident Reporting System (NFIRS) incidents
- Incident types reported to NFIRS in New Durham, NH
- 76945.7%Rescue & EMS
- 30818.3%Fire
- 20712.3%Hazardous Condition
- 1599.5%Good Intent Call
- 1257.4%Service Call
- 955.6%False Alarm
- 150.9%Severe Weather
- 30.2%Special Incident
- Fire incident types reported to NFIRS in New Durham, NH
- 19964.6%Structure Fires
- 8226.6%Outside Fires
- 165.2%Other
- 113.6%Mobile Property/Vehicle Fires
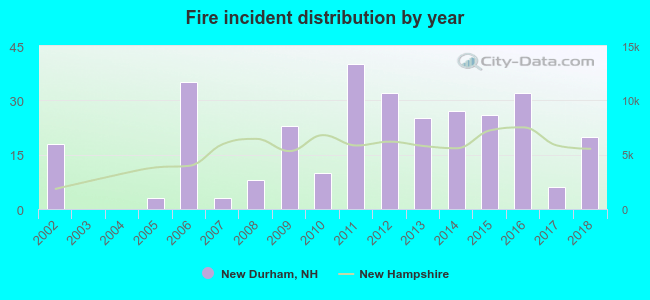 According to the data from the years 2002 - 2018 the average number of fires per year is 18. The highest number of reported fire incidents - 40 took place in 2011, and the least - 0 in 2003. The data has a rising trend.
 36.7% incidents where reported in the morning and 63.3% in the evening. The most fires (22.4%) took place on Wednesday, and the least (9.7%) on Tuesday.
 According to the 308 fire incident reports from years 2002 - 2018 most fires (15.3%) took place during April, and the least (1.9%) in September.
 Out of all 1,682 cases reported during the years 2002 - 2018, the most belonged to the categories: Rescue & EMS (45.7%), Fire (18.3%), and Hazardous Condition (12.3%).
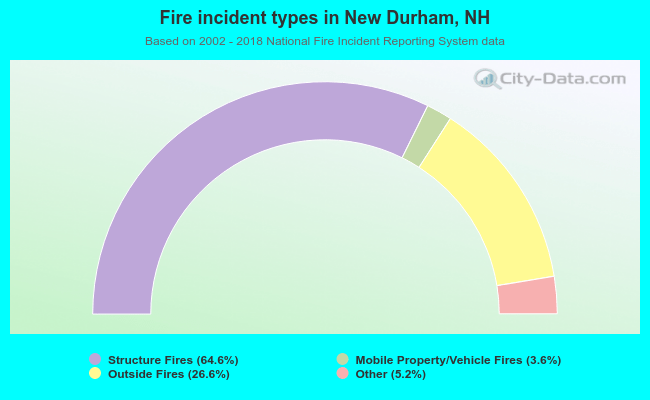 When looking into fire subcategories, the most reports belonged to: Structure Fires (64.6%), and Outside Fires (26.6%).