New Hartford: Fire Incidents, New York (NY)
Where are fire incidents reported in New Hartford, NY
Something went wrong! Please refresh the page.
|
| |||||||||||||||||||||||||||||||||||||||||||||||||||||||||||||||||||||||||||||||||||||||||||||||||||||||||||||
2002 - 2018 National Fire Incident Reporting System (NFIRS) incidents
- Incident types reported to NFIRS in New Hartford, NY
- 5,00857.8%Rescue & EMS
- 1,00211.6%False Alarm
- 8079.3%Service Call
- 7448.6%Hazardous Condition
- 6027.0%Fire
- 3874.5%Good Intent Call
- 981.1%Severe Weather
- 120.1%Overpressure Rupture
- Fire incident types reported to NFIRS in New Hartford, NY
- 37362.0%Structure Fires
- 10717.8%Mobile Property/Vehicle Fires
- 9115.1%Outside Fires
- 315.1%Other
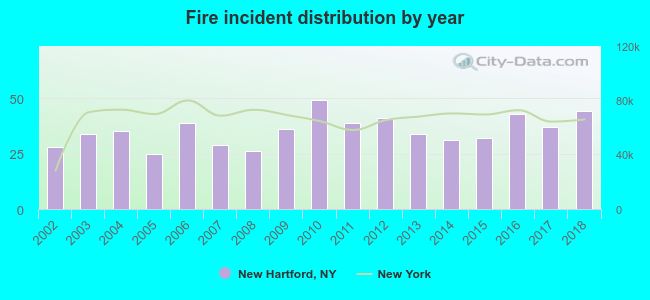 According to the data from the years 2002 - 2018 the average number of fire incidents per year is 35. The highest number of reported fire incidents - 49 took place in 2010, and the least - 25 in 2005. The data has a growing trend.
 The median response time based on all reported fire incidents is 6 minutes. This is higher than the New York median value.
 30.2% incidents where reported in the morning and 69.8% in the evening. The most fires (16.6%) took place on Sunday, and the least (12.8%) on Wednesday.
 According to the 602 fire incidents from years 2002 - 2018 most fires (10.3%) took place during June, and the least (6.1%) in September.
 Out of all 8,661 cases reported during the years 2002 - 2018, the most belonged to the categories: Rescue & EMS (57.8%), False Alarm (11.6%), and Service Call (9.3%).
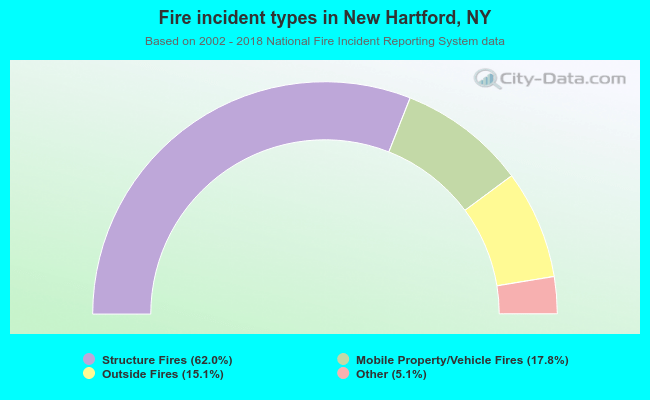 When looking into fire subcategories, the most incidents belonged to: Structure Fires (62.0%), and Mobile Property/Vehicle Fires (17.8%).