Rome: Fire Incidents, New York (NY)
Where are fire incidents reported in Rome, NY
Something went wrong! Please refresh the page.
| Fire incidents reported | |
|---|---|
| Sreet name | Count |
| DOMINICK ST | 120 |
| JAMES ST | 120 |
| BLACK RIVER BLVD | 70 |
| MADISON ST | 64 |
| FLOYD AVE | 62 |
| THOMAS ST | 54 |
| GEORGE ST | 52 |
| BLOOMFIELD ST | 44 |
| ERIE BLVD | 42 |
| LEVITT ST | 40 |
| COURT ST | 38 |
| TURIN RD | 38 |
| TURIN ST | 38 |
| DEPEYSTER ST | 36 |
| OLD ONEIDA RD | 36 |
| DEWEY RD | 34 |
| EMBARGO ST | 30 |
| LIBERTY ST | 30 |
| LAWRENCE ST | 26 |
| OLD FLOYD RD | 26 |
| RIVER RD | 26 |
| COTTAGE ST | 24 |
| ELMER HILL RD | 24 |
| OSWEGO RD | 24 |
| HENRY ST | 22 |
| ROME-TABERG RD | 20 |
| ANN ST | 18 |
| KOSSUTH ST | 18 |
| NEW FLOYD RD | 16 |
| NORTH ST | 16 |
| Other | 172 |
2002 - 2018 National Fire Incident Reporting System (NFIRS) incidents
- Incident types reported to NFIRS in Rome, NY
- 6,58652.6%Rescue & EMS
- 2,51620.1%Hazardous Condition
- 1,38011.0%Fire
- 8116.5%Service Call
- 5464.4%Good Intent Call
- 4803.8%False Alarm
- 1921.5%Severe Weather
- Fire incident types reported to NFIRS in Rome, NY
- 70551.1%Structure Fires
- 43731.7%Outside Fires
- 14510.5%Mobile Property/Vehicle Fires
- 936.7%Other
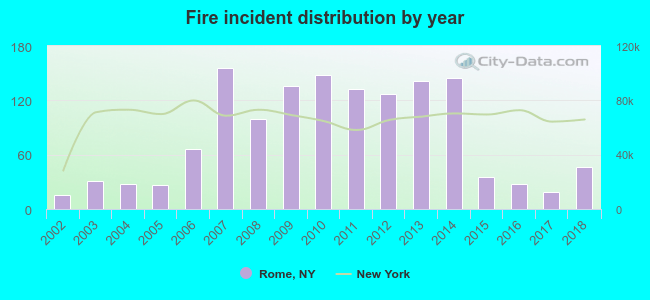 Based on the data from the years 2002 - 2018 the average number of fire incidents per year is 81. The highest number of fire incidents - 156 took place in 2007, and the least - 15 in 2002. The data has a rising trend.
The average number of yearly fire incidents per 10k residents in Rome, NY compared to nearest cities:
(Note: Based on data for the last 3 years, including only cities with population 5,000 and above)
| Rome: | 9.5 |
| Lee: | 1.5 |
| Westmoreland: | 23.4 |
| Verona: | 48.7 |
| Marcy: | 29.3 |
| Whitestown: | 1.1 |
| Oneida: | 37.2 |
| Utica: | 44.8 |
| Vienna: | 5.5 |
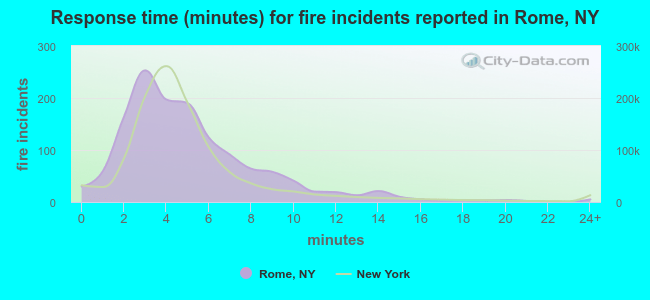 The median response time based on all reported fire incidents is 4 minutes. This is close to the state median value.
The median response time in Rome, NY compared to nearest cities:
(Note: Based on data for all years, including only cities with at least 500 fire incidents)
| Rome: | 4 minutes |
| Oneida: | 3 minutes |
| New Hartford: | 6 minutes |
| Utica: | 4 minutes |
| Canastota: | 10 minutes |
| Chittenango: | 11 minutes |
| Ilion: | 3 minutes |
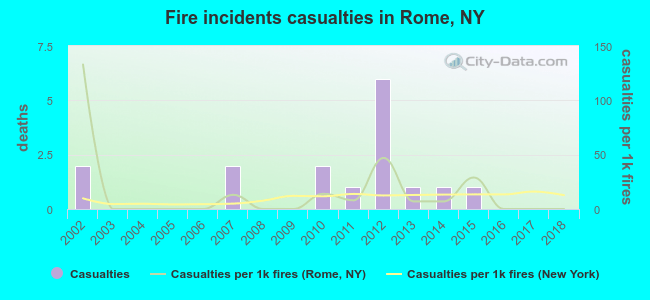 According to the reports from the years 2002 - 2018 the average number of fire-related yearly casualties is 1. The highest number of casualties - 6 took place in 2012, and the lowest - 0 in 2003. The data has a dropping trend.
The average number of casualties per 1,000 fires is 15. This indicator was the highest - 133 in 2002, and the lowest 0 in 2003. The trend for injuries per 1,000 fires is declining. Compared to the state value the number of casualties per 1,000 fire incidents is about the same.
According to the reports from the years 2002 - 2018 the average number of fire-related yearly casualties is 1. The highest number of casualties - 6 took place in 2012, and the lowest - 0 in 2003. The data has a dropping trend.
The average number of casualties per 1,000 fires is 15. This indicator was the highest - 133 in 2002, and the lowest 0 in 2003. The trend for injuries per 1,000 fires is declining. Compared to the state value the number of casualties per 1,000 fire incidents is about the same.Casualties per 1,000 incidents in Rome, NY compared to nearest cities:
(Note: Based on data for all years, including only cities with at least 500 fire incidents)
| Rome: | 11.6 |
| Oneida: | 11.8 |
| New Hartford: | 1.7 |
| Utica: | 5.9 |
| Canastota: | 0.0 |
| Chittenango: | 4.9 |
| Ilion: | 11.8 |
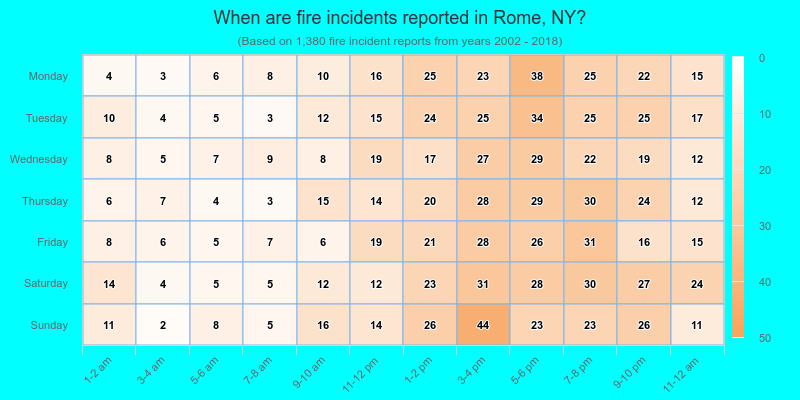
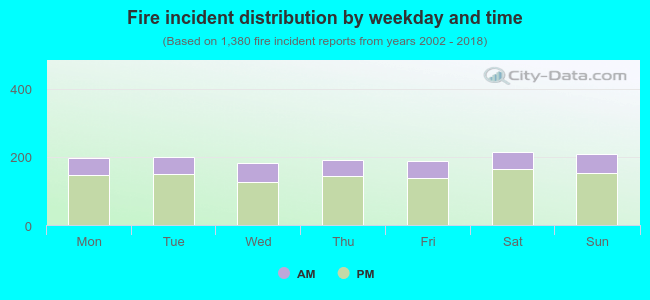 26.1% incidents where reported in the morning and 73.9% in the evening. The most fires (15.6%) took place on Saturday, and the least (13.2%) on Wednesday.
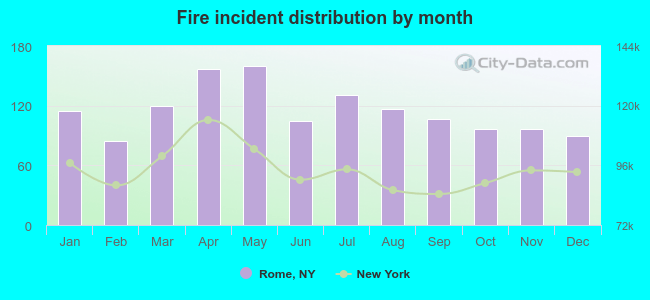 According to the 1,380 incident reports from years 2002 - 2018 most fires (11.6%) took place during May, and the least (6.1%) in February.
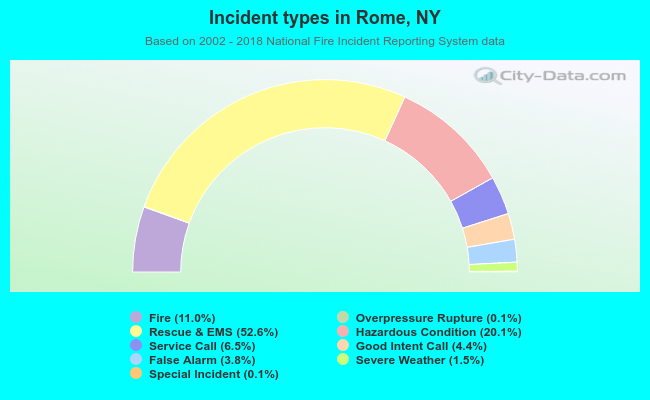 Out of all 12,529 cases reported during the years 2002 - 2018, the most belonged to the categories: Rescue & EMS (52.6%), Hazardous Condition (20.1%), and Fire (11.0%).
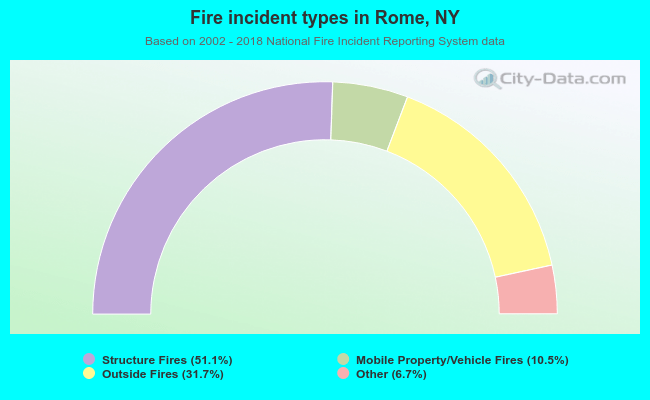 When looking into fire subcategories, the most incidents belonged to: Structure Fires (51.1%), and Outside Fires (31.7%).