Newland: Fire Incidents, North Carolina (NC)
Where are fire incidents reported in Newland, NC
Something went wrong! Please refresh the page.
|
| |||||||||||||||||||||||||||||||||||||||||||||||||||||||||||||||||||||||||||||||||||||||||||||||||||||||||||||
| Other | 218 | |||||||||||||||||||||||||||||||||||||||||||||||||||||||||||||||||||||||||||||||||||||||||||||||||||||||||||||
2002 - 2018 National Fire Incident Reporting System (NFIRS) incidents
- Incident types reported to NFIRS in Newland, NC
- 1,31843.3%Rescue & EMS
- 78025.6%Fire
- 48215.8%Hazardous Condition
- 1846.0%Good Intent Call
- 1173.8%Service Call
- 1143.7%False Alarm
- 351.1%Severe Weather
- 130.4%Special Incident
- 40.1%Overpressure Rupture
- Fire incident types reported to NFIRS in Newland, NC
- 46559.6%Structure Fires
- 21727.8%Outside Fires
- 546.9%Other
- 445.6%Mobile Property/Vehicle Fires
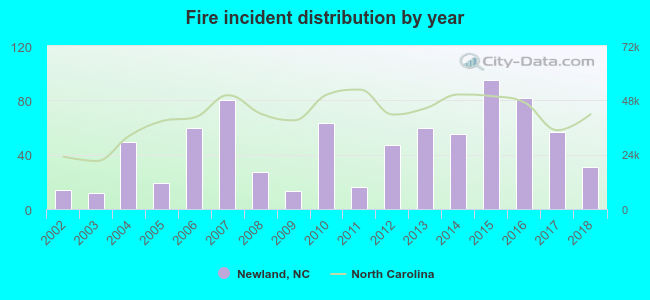 According to the data from the years 2002 - 2018 the average number of fire incidents per year is 46. The highest number of fires - 95 took place in 2015, and the least - 12 in 2003. The data has an increasing trend.
 The median response time based on all reported fire incidents is 8 minutes. This is higher compared to the North Carolina median value.
The median response time in Newland, NC compared to nearest cities:
(Note: Based on data for all years, including only cities with at least 500 fire incidents)
| Newland: | 8 minutes |
| Spruce Pine: | 10 minutes |
| Boone: | 6 minutes |
| Burnsville: | 9 minutes |
| Lenoir: | 4 minutes |
| Morganton: | 7 minutes |
| Marion: | 9 minutes |
| Hudson: | 4 minutes |
| Valdese: | 6 minutes |
 32.3% incidents where reported in the morning and 67.7% in the evening. The most fires (16.5%) took place on Wednesday, and the least (12.2%) on Thursday.
 Based on the 780 fire incidents from years 2002 - 2018 most fires (15.5%) took place during April, and the least (3.6%) in June.
 Out of all 3,047 cases reported during the years 2002 - 2018, the most belonged to the categories: Rescue & EMS (43.3%), Fire (25.6%), and Hazardous Condition (15.8%).
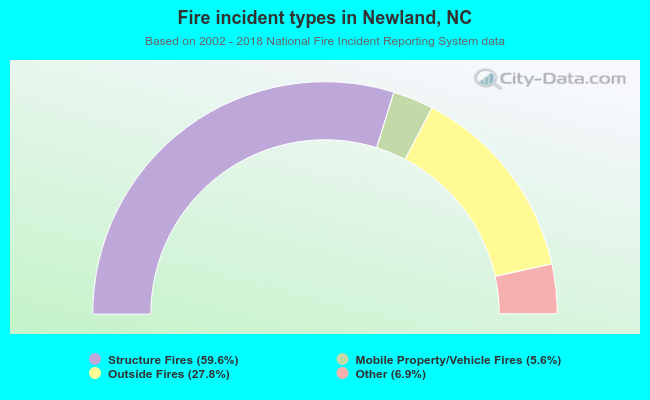 When looking into fire subcategories, the most incidents belonged to: Structure Fires (59.6%), and Outside Fires (27.8%).