Winchester: Fire Incidents, Kentucky (KY)
Where are fire incidents reported in Winchester, KY
Something went wrong! Please refresh the page.
| Fire incidents reported | |
|---|---|
| Sreet name | Count |
| BYPASS RD | 126 |
| I64 | 98 |
| MAIN ST | 94 |
| LEXINGTON AVE | 78 |
| IRVINE RD | 66 |
| IRONWORKS RD | 58 |
| ECTON RD | 50 |
| OXFORD DR | 50 |
| WASHINGTON ST | 48 |
| MAPLE ST | 46 |
| WINN AVE | 44 |
| BROADWAY | 42 |
| MOUNTAIN PKY | 42 |
| LEXINGTON RD | 40 |
| MUDDY CREEK RD | 36 |
| BROADWAY ST | 34 |
| MT STERLING RD | 34 |
| OLD BOONESBORO RD | 30 |
| I-64 | 28 |
| COLBY RD | 26 |
| COLLEGE AVE | 24 |
| WADES MILL RD | 24 |
| COOK AVE | 22 |
| ENTERPRISE DR | 22 |
| ROCKWELL RD | 22 |
| BURNS AVE | 20 |
| HIGHLAND ST | 20 |
| LINDEN AVE | 20 |
| MAGNOLIA ST | 20 |
| SCHOLLSVILLE RD | 20 |
| Other | 763 |
2004 - 2018 National Fire Incident Reporting System (NFIRS) incidents
- Incident types reported to NFIRS in Winchester, KY
- 26,24980.7%Rescue & EMS
- 2,0476.3%Fire
- 1,1873.6%Service Call
- 1,1153.4%Hazardous Condition
- 1,0233.1%False Alarm
- 8182.5%Good Intent Call
- 500.2%Overpressure Rupture
- Fire incident types reported to NFIRS in Winchester, KY
- 83340.7%Outside Fires
- 69634.0%Structure Fires
- 40920.0%Mobile Property/Vehicle Fires
- 1095.3%Other
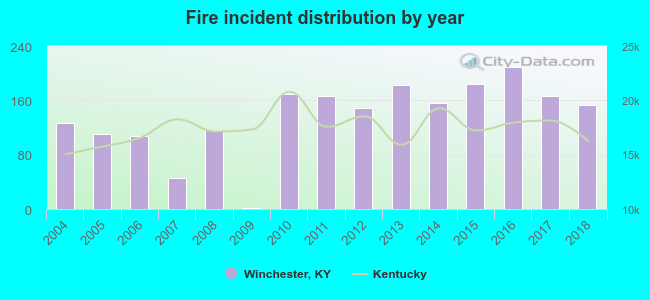 According to the data from the years 2004 - 2018 the average number of fire incidents per year is 136. The highest number of reported fire incidents - 209 took place in 2016, and the least - 1 in 2009. The data has a growing trend.
The average number of yearly fire incidents per 10k residents in Winchester, KY compared to nearest cities:
(Note: Based on data for the last 3 years, including only cities with population 5,000 and above)
| Winchester: | 95.6 |
| Mount Sterling: | 1.4 |
| Paris: | 76.3 |
| Richmond: | 89.8 |
| Nicholasville: | 62.1 |
| Georgetown: | 39.4 |
| Wilmore: | 12.5 |
| Cynthiana: | 105.3 |
| Berea: | 36.2 |
 The median response time based on all reported fire incidents is 5 minutes. This is lower than the Kentucky median value.
The median response time in Winchester, KY compared to nearest cities:
(Note: Based on data for all years, including only cities with at least 500 fire incidents)
| Winchester: | 5 minutes |
| Paris: | 7 minutes |
| Richmond: | 7 minutes |
| Nicholasville: | 6 minutes |
| Irvine: | 13 minutes |
| Georgetown: | 5 minutes |
| Cynthiana: | 4 minutes |
| Berea: | 9 minutes |
| Versailles: | 4 minutes |
 Based on the reports from the years 2004 - 2018 the average number of fire-related fatalities per year is 0. The highest number of deaths - 4 took place in 2016, and the lowest - 0 in 2005. The data has a dropping trend.
 Based on the data from the years 2004 - 2018 the average number of fire-related yearly casualties is 1. The highest number of reported injuries - 5 took place in 2016, and the lowest - 0 in 2005. The data has a declining trend.
The average number of injuries per 1,000 fire incidents is 5. This indicator was the highest - 24 in 2016, and the lowest 0 in 2005. The trend for injuries per 1,000 fires is dropping. Compared to the state value the number of casualties per 1,000 incidents is about the same.
Based on the data from the years 2004 - 2018 the average number of fire-related yearly casualties is 1. The highest number of reported injuries - 5 took place in 2016, and the lowest - 0 in 2005. The data has a declining trend.
The average number of injuries per 1,000 fire incidents is 5. This indicator was the highest - 24 in 2016, and the lowest 0 in 2005. The trend for injuries per 1,000 fires is dropping. Compared to the state value the number of casualties per 1,000 incidents is about the same.Casualties per 1,000 incidents in Winchester, KY compared to nearest cities:
(Note: Based on data for all years, including only cities with at least 500 fire incidents)
| Winchester: | 5.9 |
| Paris: | 3.5 |
| Richmond: | 10.4 |
| Nicholasville: | 15.5 |
| Irvine: | 8.1 |
| Georgetown: | 10.4 |
| Cynthiana: | 9.0 |
| Berea: | 7.3 |
| Versailles: | 3.8 |
 29.6% incidents where reported in the morning and 70.4% in the evening. The most fires (15.4%) took place on Saturday, and the least (13.6%) on Friday.
 According to the 2,047 fire incident reports from years 2004 - 2018 most fires (9.8%) took place during March, and the least (6.9%) in December.
 Out of all 32,521 cases reported during the years 2004 - 2018, the most belonged to the categories: Rescue & EMS (80.7%), Fire (6.3%), and Service Call (3.6%).
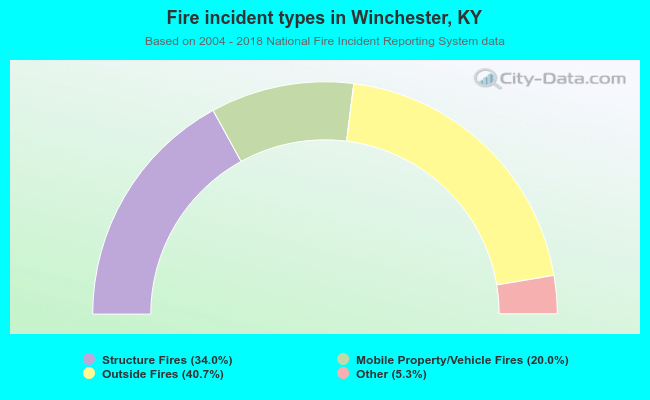 When looking into fire subcategories, the most reports belonged to: Outside Fires (40.7%), and Structure Fires (34.0%).