Norridge: Fire Incidents, Illinois (IL)
Where are fire incidents reported in Norridge, IL
Something went wrong! Please refresh the page.
|
| |||||||||||||||||||||||||||||||||||||||||||||||||||||||||||||||||||||||||||||||||||||||||||||||||||||||||||||
2002 - 2018 National Fire Incident Reporting System (NFIRS) incidents
- Incident types reported to NFIRS in Norridge, IL
- 3,42954.6%Rescue & EMS
- 91514.6%Good Intent Call
- 6229.9%False Alarm
- 6059.6%Hazardous Condition
- 3675.8%Fire
- 3305.3%Service Call
- Fire incident types reported to NFIRS in Norridge, IL
- 18450.1%Structure Fires
- 10729.2%Outside Fires
- 5113.9%Mobile Property/Vehicle Fires
- 256.8%Other
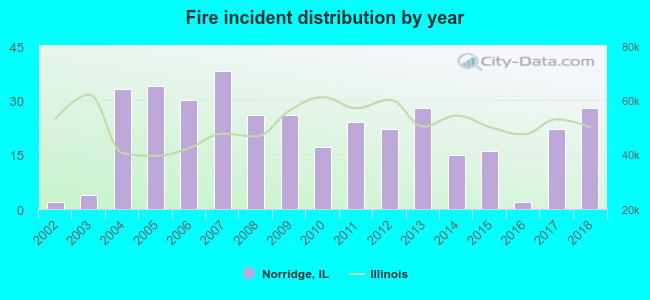 According to the data from the years 2002 - 2018 the average number of fire incidents per year is 22. The highest number of reported fires - 38 took place in 2007, and the least - 2 in 2002. The data has a rising trend.
The average number of yearly fire incidents per 10k residents in Norridge, IL compared to nearest cities:
(Note: Based on data for the last 3 years, including only cities with population 5,000 and above)
| Norridge: | 11.8 |
| Harwood Heights: | 22.5 |
| Schiller Park: | 49.5 |
| River Grove: | 29.2 |
| Elmwood Park: | 26.3 |
| Franklin Park: | 39.5 |
| Park Ridge: | 14.3 |
| Niles: | 20.0 |
| Melrose Park: | 35.1 |
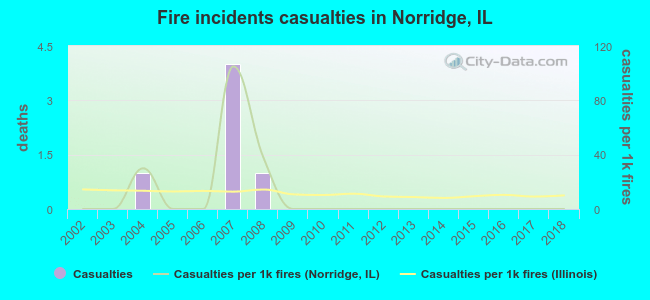 According to the data from the years 2002 - 2018 the average number of fire-related casualties per year is 0. The highest number of injuries - 4 took place in 2007, and the lowest - 0 in 2002. The data has a constant trend.
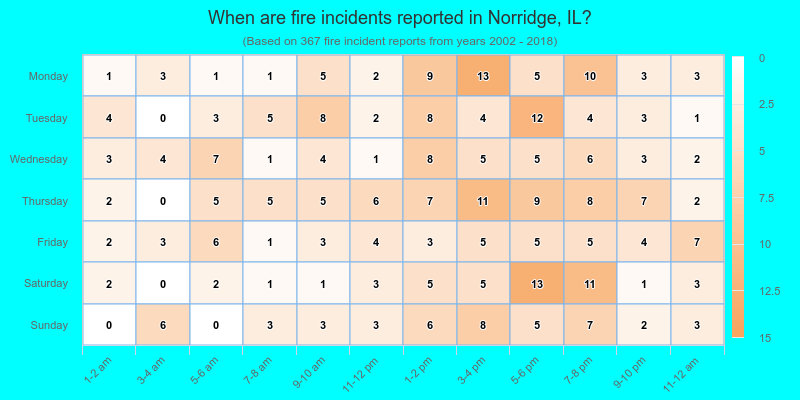
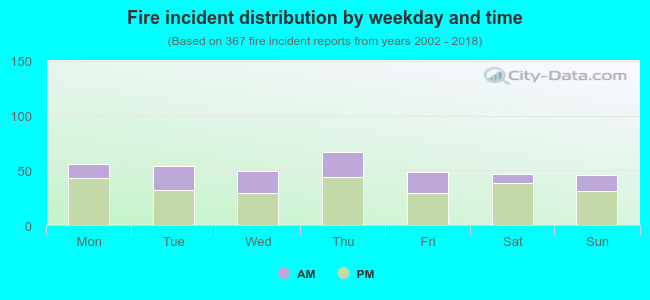 33.0% incidents where reported in the morning and 67.0% in the evening. The most fires (18.3%) took place on Thursday, and the least (12.5%) on Sunday.
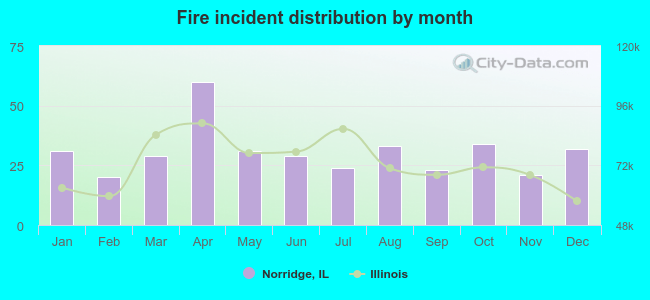 According to the 367 fire incidents from years 2002 - 2018 most fires (16.3%) took place during April, and the least (5.4%) in February.
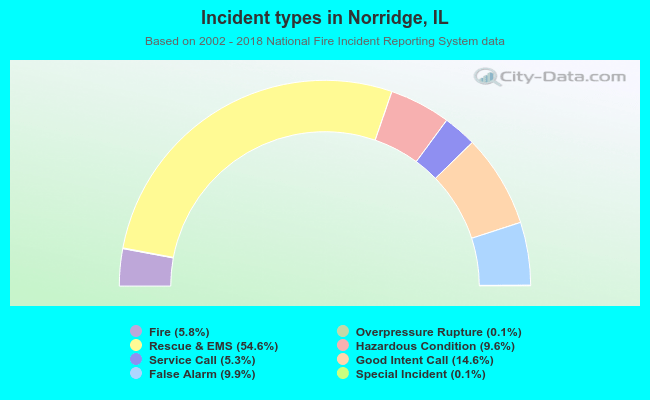 Out of all 6,279 cases reported during the years 2002 - 2018, the most belonged to the categories: Rescue & EMS (54.6%), Good Intent Call (14.6%), and False Alarm (9.9%).
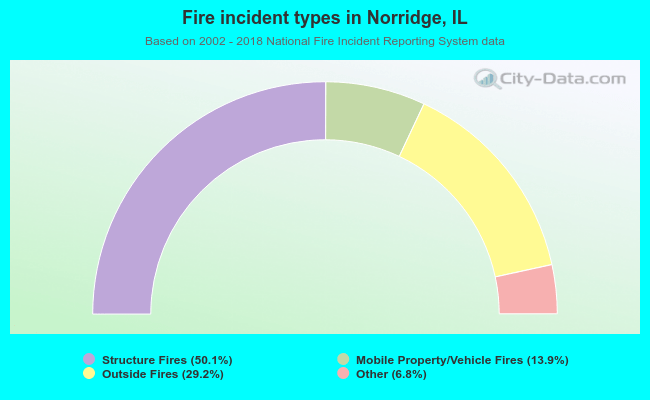 When looking into fire subcategories, the most incidents belonged to: Structure Fires (50.1%), and Outside Fires (29.2%).