River Grove: Fire Incidents, Illinois (IL)
Where are fire incidents reported in River Grove, IL
Something went wrong! Please refresh the page.
|
| |||||||||||||||||||||||||||||||||||||||||||||||||||||||||||||||||||||||||||||||||||||||||||||||||||||||||||||
2002 - 2018 National Fire Incident Reporting System (NFIRS) incidents
- Incident types reported to NFIRS in River Grove, IL
- 3,43749.8%Rescue & EMS
- 1,06815.5%Good Intent Call
- 6529.4%Fire
- 6439.3%False Alarm
- 5638.2%Hazardous Condition
- 5117.4%Service Call
- 210.3%Special Incident
- Fire incident types reported to NFIRS in River Grove, IL
- 31348.0%Structure Fires
- 18628.5%Outside Fires
- 10015.3%Other
- 538.1%Mobile Property/Vehicle Fires
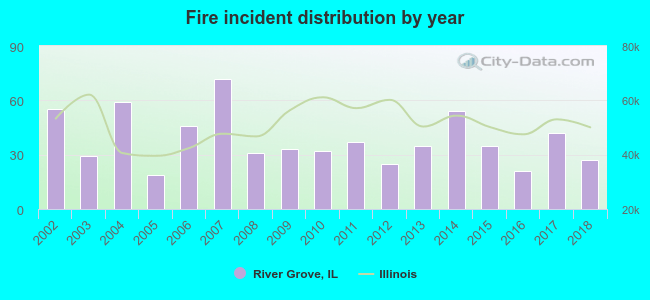 Based on the data from the years 2002 - 2018 the average number of fires per year is 38. The highest number of reported fire incidents - 72 took place in 2007, and the least - 19 in 2005. The data has a dropping trend.
The average number of yearly fire incidents per 10k residents in River Grove, IL compared to nearest cities:
(Note: Based on data for the last 3 years, including only cities with population 5,000 and above)
| River Grove: | 29.2 |
| Elmwood Park: | 26.3 |
| Franklin Park: | 39.5 |
| Melrose Park: | 35.1 |
| River Forest: | 50.6 |
| Schiller Park: | 49.5 |
| Norridge: | 11.8 |
| Maywood: | 58.8 |
| Northlake: | 33.7 |
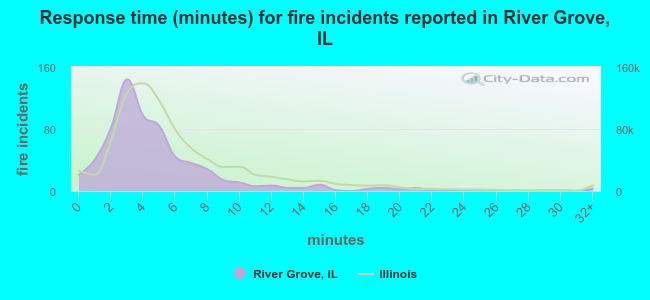 The median response time based on all reported fire incidents is 4 minutes. This is lower than the state median value.
The median response time in River Grove, IL compared to nearest cities:
(Note: Based on data for all years, including only cities with at least 500 fire incidents)
| River Grove: | 4 minutes |
| Elmwood Park: | 5 minutes |
| Franklin Park: | 4 minutes |
| Melrose Park: | 4 minutes |
| River Forest: | 6 minutes |
| Schiller Park: | 4 minutes |
| Maywood: | 3 minutes |
| Northlake: | 5 minutes |
| Bellwood: | 3 minutes |
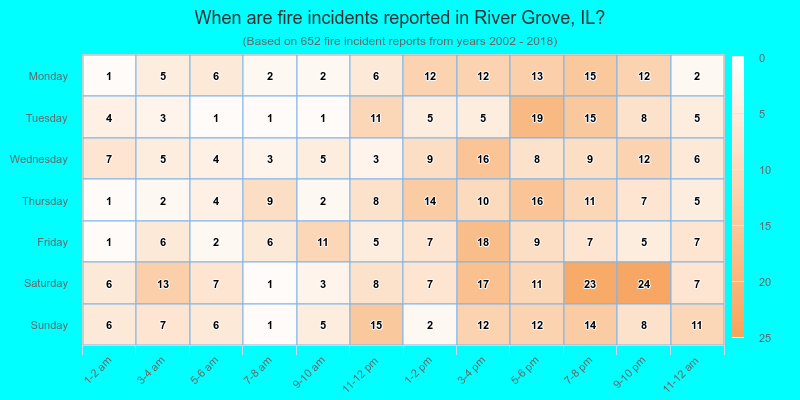
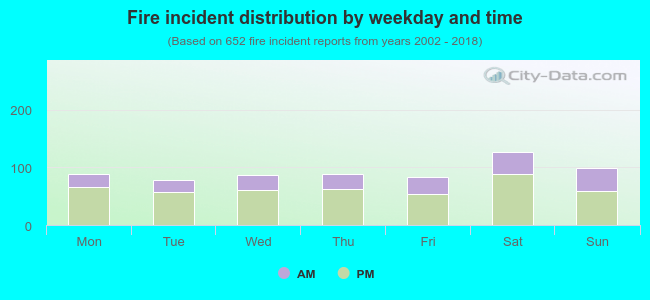 31.4% incidents where reported in the morning and 68.6% in the evening. The most fires (19.5%) took place on Saturday, and the least (12.0%) on Tuesday.
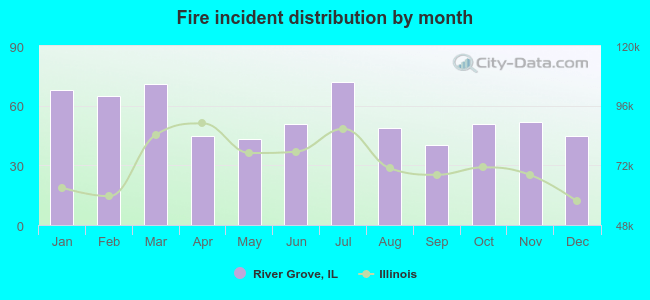 According to the 652 incident reports from years 2002 - 2018 most fires (11.0%) took place during July, and the least (6.1%) in September.
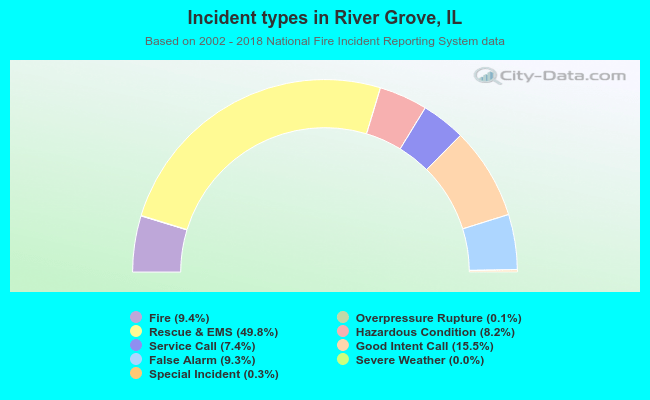 Out of all 6,901 cases reported during the years 2002 - 2018, the most belonged to the categories: Rescue & EMS (49.8%), Good Intent Call (15.5%), and Fire (9.4%).
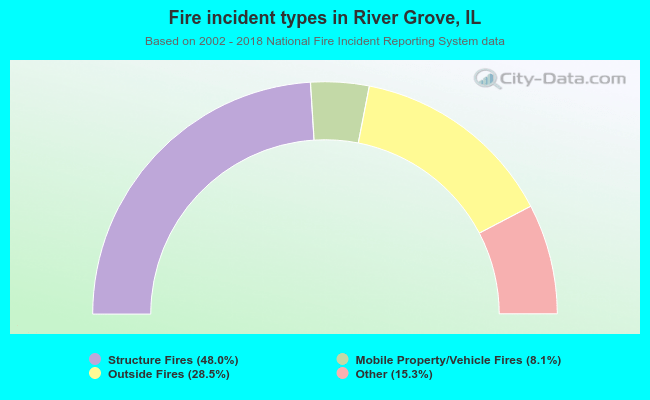 When looking into fire subcategories, the most reports belonged to: Structure Fires (48.0%), and Outside Fires (28.5%).