Norristown: Fire Incidents, Pennsylvania (PA)
Where are fire incidents reported in Norristown, PA
Something went wrong! Please refresh the page.
| Fire incidents reported | |
|---|---|
| Sreet name | Count |
| MAIN ST | 372 |
| MARSHALL ST | 180 |
| AIRY ST | 158 |
| DEKALB ST | 156 |
| STANBRIDGE ST | 156 |
| SWEDE ST | 126 |
| ARCH ST | 120 |
| HAWS AVE | 106 |
| TROOPER RD | 106 |
| MARKLEY ST | 104 |
| KOHN ST | 102 |
| POWELL ST | 86 |
| WALNUT ST | 84 |
| CHAIN ST | 72 |
| CHERRY ST | 68 |
| LAFAYETTE ST | 66 |
| OAK ST | 62 |
| PINE ST | 62 |
| SANDY ST | 62 |
| ELM ST | 60 |
| MOORE ST | 58 |
| GEORGE ST | 56 |
| GREEN ST | 56 |
| WASHINGTON ST | 56 |
| NOBLE ST | 54 |
| FOREST AVE | 50 |
| FORNANCE ST | 48 |
| WILLOW ST | 46 |
| EGYPT RD | 44 |
| SPRUCE ST | 44 |
2003 - 2018 National Fire Incident Reporting System (NFIRS) incidents
- Incident types reported to NFIRS in Norristown, PA
- 2,51034.6%Fire
- 1,91326.4%Hazardous Condition
- 1,27017.5%False Alarm
- 6969.6%Service Call
- 4826.7%Good Intent Call
- 2813.9%Rescue & EMS
- 891.2%Special Incident
- Fire incident types reported to NFIRS in Norristown, PA
- 1,74169.4%Structure Fires
- 46218.4%Outside Fires
- 1546.1%Mobile Property/Vehicle Fires
- 1536.1%Other
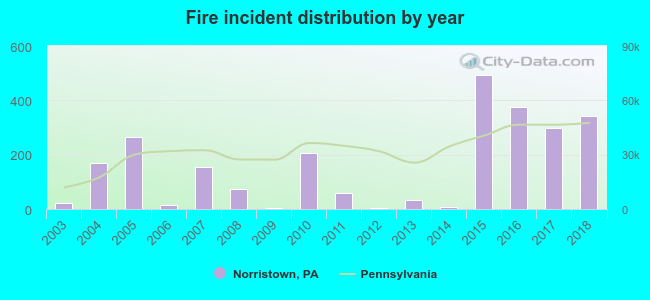 According to the data from the years 2003 - 2018 the average number of fires per year is 157. The highest number of reported fire incidents - 492 took place in 2015, and the least - 2 in 2009. The data has a rising trend.
The average number of yearly fire incidents per 10k residents in Norristown, PA compared to nearest cities:
(Note: Based on data for the last 3 years, including only cities with population 5,000 and above)
| Norristown: | 98.0 |
| West Norriton: | 4.1 |
| East Norriton: | 30.3 |
| King of Prussia: | 82.4 |
| Plymouth Meeting: | 33.5 |
| Trooper: | 7.5 |
| Conshohocken: | 65.9 |
| Blue Bell: | 16.5 |
| Audubon: | 30.8 |
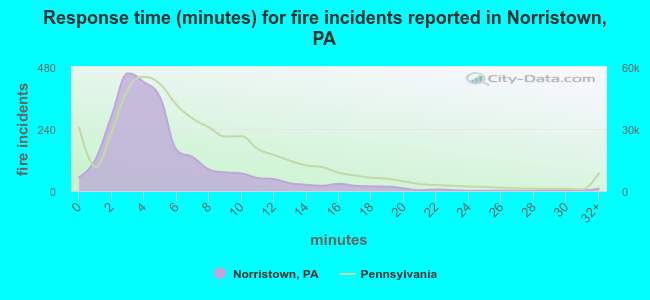 The median response time based on all reported fire incidents is 4 minutes. This is lower compared to the state median value.
The median response time in Norristown, PA compared to nearest cities:
(Note: Based on data for all years, including only cities with at least 500 fire incidents)
| Norristown: | 4 minutes |
| King of Prussia: | 8 minutes |
| Conshohocken: | 5 minutes |
| Berwyn: | 8 minutes |
| Phoenixville: | 6 minutes |
| Broomall: | 6 minutes |
| Malvern: | 9 minutes |
| Spring City: | 6 minutes |
| Horsham: | 6 minutes |
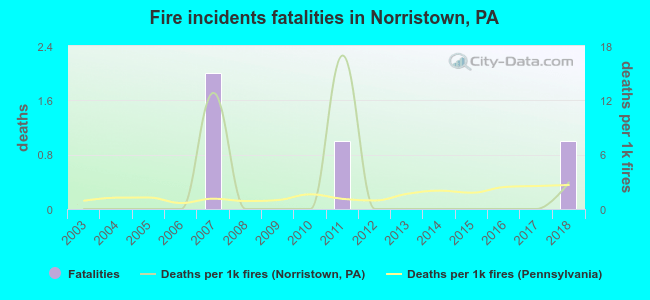 According to the data from the years 2003 - 2018 the average number of fire-related yearly deaths is 0. The highest number of reported deaths - 2 took place in 2007, and the lowest - 0 in 2003. The data has a rising trend.
The average number of deaths per 1,000 fire incidents is 2. This indicator was the highest - 17 in 2011, and the lowest 0 in 2003. The trend for deaths per 1,000 fire incidents is rising. Compared to the state value the number of fatalities per 1,000 fire incidents is similar.
According to the data from the years 2003 - 2018 the average number of fire-related yearly deaths is 0. The highest number of reported deaths - 2 took place in 2007, and the lowest - 0 in 2003. The data has a rising trend.
The average number of deaths per 1,000 fire incidents is 2. This indicator was the highest - 17 in 2011, and the lowest 0 in 2003. The trend for deaths per 1,000 fire incidents is rising. Compared to the state value the number of fatalities per 1,000 fire incidents is similar.Deaths per 1,000 incidents in Norristown, PA compared to nearest cities:
(Note: Based on data for all years, including only cities with at least 2,500 fire incidents)
| Norristown: | 1.6 |
| Philadelphia: | 2.7 |
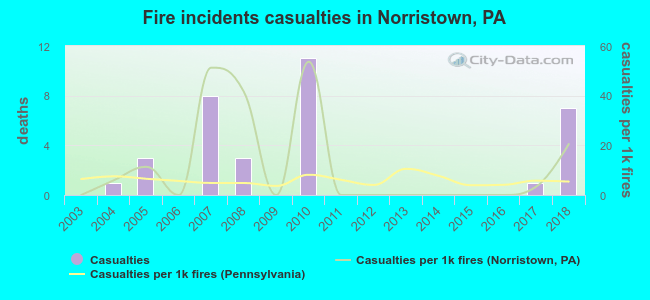 Based on the reports from the years 2003 - 2018 the average number of fire-related yearly casualties is 2. The highest number of reported casualties - 11 took place in 2010, and the lowest - 0 in 2003. The data has a growing trend.
The average number of casualties per 1,000 fires is 12. This indicator was the highest - 54 in 2010, and the lowest 0 in 2003. The trend for casualties per 1,000 fire incidents is increasing. Compared to the Pennsylvania value the number of casualties per 1,000 fires is much higher.
Based on the reports from the years 2003 - 2018 the average number of fire-related yearly casualties is 2. The highest number of reported casualties - 11 took place in 2010, and the lowest - 0 in 2003. The data has a growing trend.
The average number of casualties per 1,000 fires is 12. This indicator was the highest - 54 in 2010, and the lowest 0 in 2003. The trend for casualties per 1,000 fire incidents is increasing. Compared to the Pennsylvania value the number of casualties per 1,000 fires is much higher.Casualties per 1,000 incidents in Norristown, PA compared to nearest cities:
(Note: Based on data for all years, including only cities with at least 500 fire incidents)
| Norristown: | 13.5 |
| King of Prussia: | 2.0 |
| Conshohocken: | 6.0 |
| Berwyn: | 1.7 |
| Phoenixville: | 14.0 |
| Broomall: | 5.7 |
| Malvern: | 7.7 |
| Spring City: | 1.6 |
| Horsham: | 3.9 |
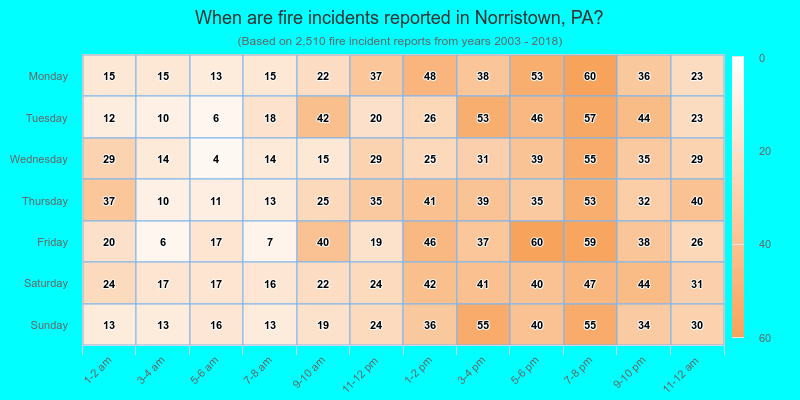
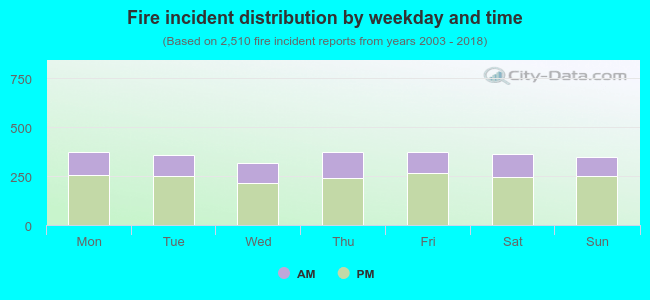 31.4% incidents where reported in the morning and 68.6% in the evening. The most fires (14.9%) took place on Monday, and the least (12.7%) on Wednesday.
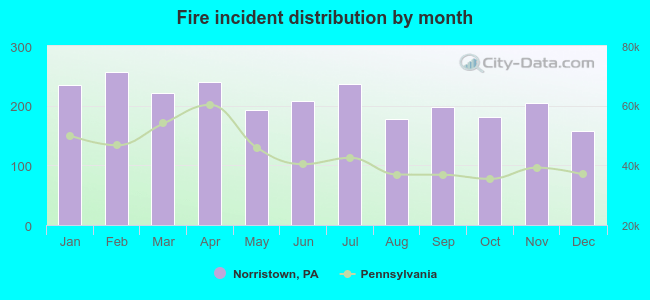 Based on the 2,510 reports from years 2003 - 2018 most fires (10.2%) took place during February, and the least (6.3%) in December.
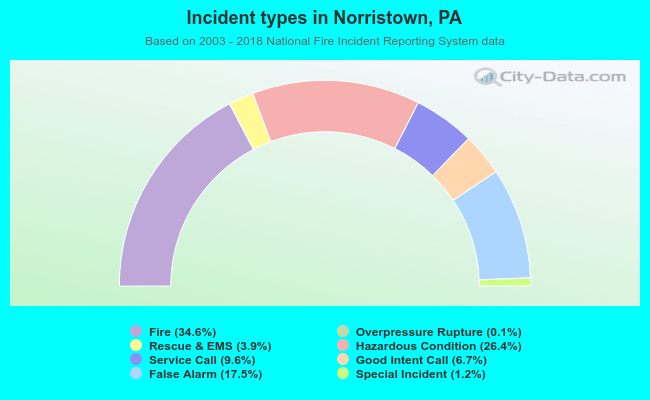 Out of all 7,246 cases reported during the years 2003 - 2018, the most belonged to the categories: Fire (34.6%), Hazardous Condition (26.4%), and False Alarm (17.5%).
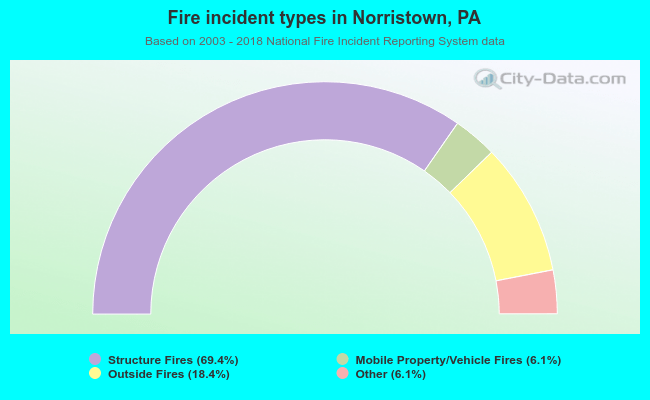 When looking into fire subcategories, the most incidents belonged to: Structure Fires (69.4%), and Outside Fires (18.4%).