Conshohocken: Fire Incidents, Pennsylvania (PA)
Where are fire incidents reported in Conshohocken, PA
Something went wrong! Please refresh the page.
|
| |||||||||||||||||||||||||||||||||||||||||||||||||||||||||||||||||||||||||||||||||||||||||||||||||||||||||||||
2003 - 2018 National Fire Incident Reporting System (NFIRS) incidents
- Incident types reported to NFIRS in Conshohocken, PA
- 52328.4%Hazardous Condition
- 51227.8%False Alarm
- 50327.3%Fire
- 1457.9%Service Call
- 1055.7%Rescue & EMS
- 482.6%Good Intent Call
- 60.3%Special Incident
- Fire incident types reported to NFIRS in Conshohocken, PA
- 30861.2%Structure Fires
- 11522.9%Outside Fires
- 7314.5%Mobile Property/Vehicle Fires
- 71.4%Other
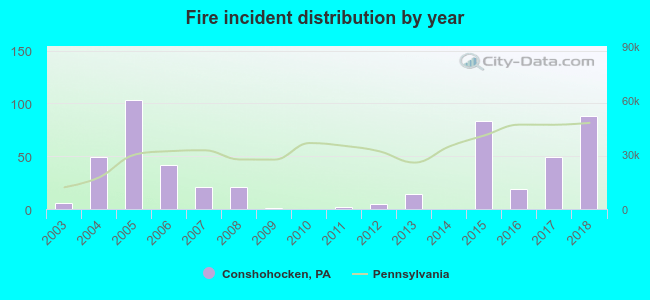 Based on the data from the years 2003 - 2018 the average number of fire incidents per year is 31. The highest number of fires - 103 took place in 2005, and the least - 0 in 2010. The data has a growing trend.
The average number of yearly fire incidents per 10k residents in Conshohocken, PA compared to nearest cities:
(Note: Based on data for the last 3 years, including only cities with population 5,000 and above)
| Conshohocken: | 65.9 |
| Plymouth Meeting: | 33.5 |
| Norristown: | 98.0 |
| King of Prussia: | 82.4 |
| Blue Bell: | 16.5 |
| East Norriton: | 30.3 |
| Ardmore: | 11.8 |
| West Norriton: | 4.1 |
| Wyndmoor: | 41.2 |
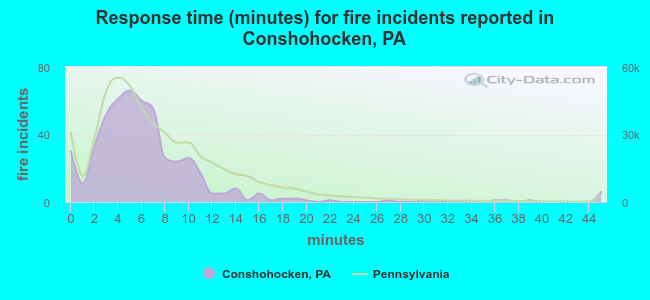 The median response time based on all reported fire incidents is 5 minutes. This is lower than the state median value.
The median response time in Conshohocken, PA compared to nearest cities:
(Note: Based on data for all years, including only cities with at least 500 fire incidents)
| Conshohocken: | 5 minutes |
| Norristown: | 4 minutes |
| King of Prussia: | 8 minutes |
| Berwyn: | 8 minutes |
| Broomall: | 6 minutes |
| Philadelphia: | 4 minutes |
| Yeadon: | 5 minutes |
| Darby: | 5 minutes |
| Collingdale: | 4 minutes |
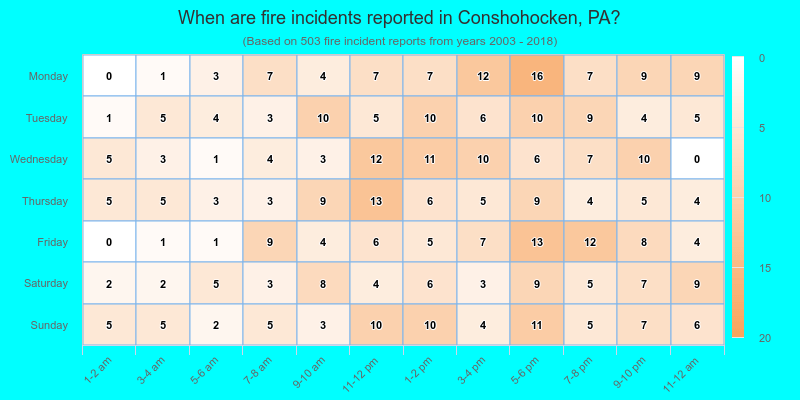
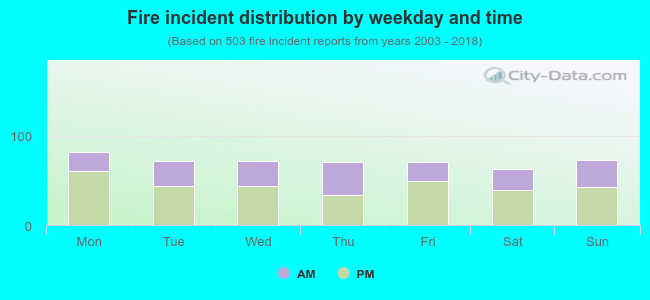 38.0% incidents where reported in the morning and 62.0% in the evening. The most fires (16.3%) took place on Monday, and the least (12.5%) on Saturday.
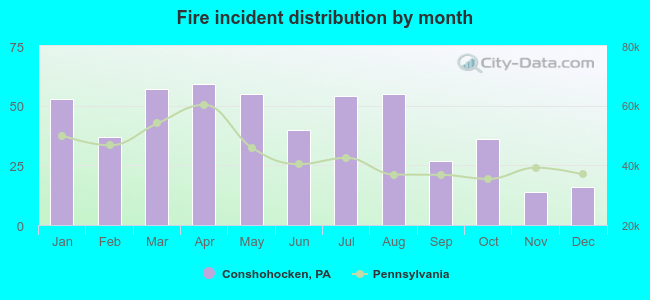 Based on the 503 incident reports from years 2003 - 2018 most fires (11.7%) took place during April, and the least (2.8%) in November.
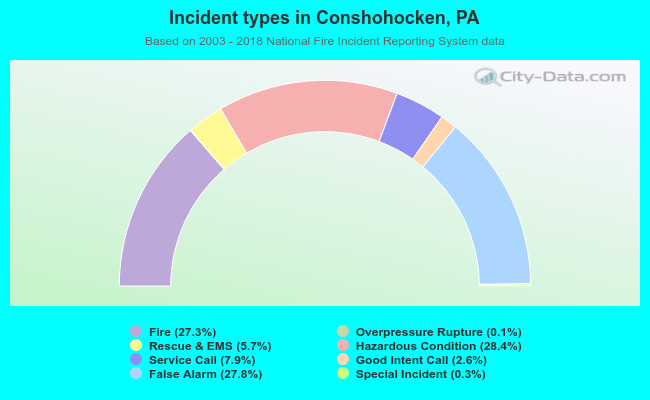 Out of all 1,843 cases reported during the years 2003 - 2018, the most belonged to the categories: Hazardous Condition (28.4%), False Alarm (27.8%), and Fire (27.3%).
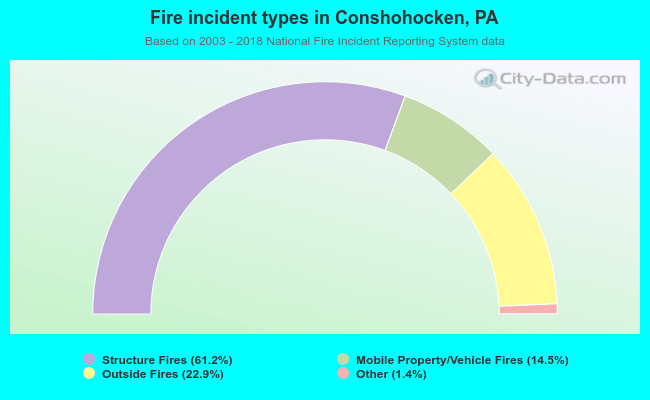 When looking into fire subcategories, the most reports belonged to: Structure Fires (61.2%), and Outside Fires (22.9%).