North Chicago: Fire Incidents, Illinois (IL)
Where are fire incidents reported in North Chicago, IL
Something went wrong! Please refresh the page.
| Fire incidents reported | |
|---|---|
| Sreet name | Count |
| LEWIS AVE | 308 |
| SHERIDAN RD | 168 |
| JACKSON ST | 146 |
| VICTORIA ST | 96 |
| LINCOLN AVE | 90 |
| BROADWAY AVE | 88 |
| GREEN BAY RD | 86 |
| PARK AVE | 86 |
| 14TH ST | 78 |
| HERVEY AVE | 70 |
| 22ND / ML KING | 68 |
| SEYMOUR AVE | 58 |
| 10TH ST | 52 |
| 20TH ST | 50 |
| GROVE AVE | 48 |
| PRAIRIE VIEW CT | 48 |
| GREENFIELD AVE | 46 |
| ELIZABETH AVE | 42 |
| 16TH ST | 40 |
| BUCKLEY RD | 40 |
| 22ND ML KING | 38 |
| ARGONNE DR 19TH ST | 38 |
| HONORE AVE | 38 |
| KEMBLE AVE | 38 |
| SHERMAN AVE | 38 |
| KRISTAN AVE | 36 |
| 18TH ST | 34 |
| DICKEY AVE | 34 |
| PROSPECT AVE | 34 |
| 24TH ST | 32 |
2002 - 2018 National Fire Incident Reporting System (NFIRS) incidents
- Incident types reported to NFIRS in North Chicago, IL
- 11,28970.6%Rescue & EMS
- 1,59610.0%Fire
- 9776.1%Hazardous Condition
- 8765.5%False Alarm
- 6444.0%Good Intent Call
- 5063.2%Service Call
- 660.4%Special Incident
- 270.2%Overpressure Rupture
- Fire incident types reported to NFIRS in North Chicago, IL
- 90156.5%Structure Fires
- 42226.4%Outside Fires
- 19912.5%Mobile Property/Vehicle Fires
- 744.6%Other
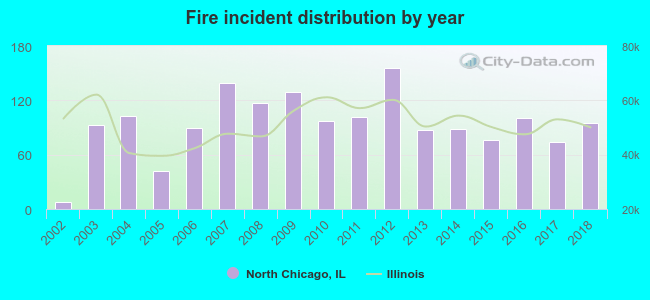 According to the data from the years 2002 - 2018 the average number of fires per year is 94. The highest number of fires - 156 took place in 2012, and the least - 8 in 2002. The data has a growing trend.
The average number of yearly fire incidents per 10k residents in North Chicago, IL compared to nearest cities:
(Note: Based on data for the last 3 years, including only cities with population 5,000 and above)
| North Chicago: | 29.5 |
| Park City: | 14.8 |
| Lake Bluff: | 55.0 |
| Waukegan: | 31.8 |
| Gurnee: | 23.7 |
| Libertyville: | 43.1 |
| Lake Forest: | 29.4 |
| Beach Park: | 45.0 |
| Gages Lake: | 1.3 |
 The median response time based on all reported fire incidents is 3 minutes. This is lower than the state median value.
The median response time in North Chicago, IL compared to nearest cities:
(Note: Based on data for all years, including only cities with at least 500 fire incidents)
| North Chicago: | 3 minutes |
| Lake Bluff: | 5 minutes |
| Waukegan: | 5 minutes |
| Gurnee: | 6 minutes |
| Libertyville: | 5 minutes |
| Lake Forest: | 6 minutes |
| Beach Park: | 6 minutes |
| Wadsworth: | 7 minutes |
| Vernon Hills: | 5 minutes |
 According to the reports from the years 2002 - 2018 the average number of fire-related casualties per year is 1. The highest number of injuries - 3 took place in 2015, and the lowest - 0 in 2002. The data has a constant trend.
The average number of casualties per 1,000 fire incidents is 7. This indicator was the highest - 39 in 2015, and the lowest 0 in 2002. The trend for casualties per 1,000 incidents is rising. Compared to the state value the number of injuries per 1,000 incidents is lower.
According to the reports from the years 2002 - 2018 the average number of fire-related casualties per year is 1. The highest number of injuries - 3 took place in 2015, and the lowest - 0 in 2002. The data has a constant trend.
The average number of casualties per 1,000 fire incidents is 7. This indicator was the highest - 39 in 2015, and the lowest 0 in 2002. The trend for casualties per 1,000 incidents is rising. Compared to the state value the number of injuries per 1,000 incidents is lower.Casualties per 1,000 incidents in North Chicago, IL compared to nearest cities:
(Note: Based on data for all years, including only cities with at least 500 fire incidents)
| North Chicago: | 6.9 |
| Lake Bluff: | 9.5 |
| Waukegan: | 23.1 |
| Gurnee: | 25.4 |
| Libertyville: | 4.3 |
| Lake Forest: | 27.7 |
| Beach Park: | 8.1 |
| Wadsworth: | 5.1 |
| Vernon Hills: | 25.7 |
 35.5% incidents where reported in the morning and 64.5% in the evening. The most fires (15.4%) took place on Sunday, and the least (12.3%) on Tuesday.
 Based on the 1,596 fire incident reports from years 2002 - 2018 most fires (10.5%) took place during July, and the least (6.8%) in October.
 Out of all 15,982 cases reported during the years 2002 - 2018, the most belonged to the categories: Rescue & EMS (70.6%), Fire (10.0%), and Hazardous Condition (6.1%).
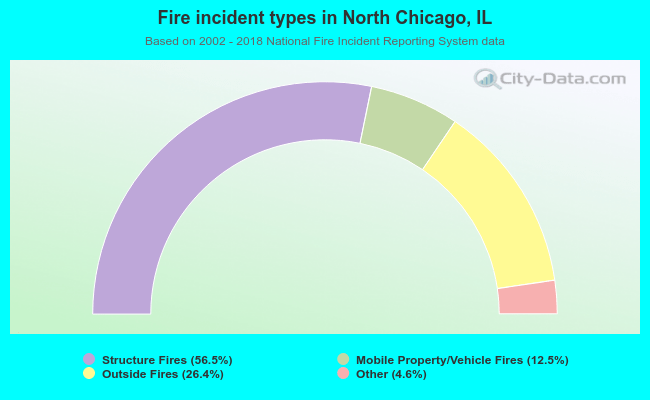 When looking into fire subcategories, the most reports belonged to: Structure Fires (56.5%), and Outside Fires (26.4%).