Libertyville: Fire Incidents, Illinois (IL)
Where are fire incidents reported in Libertyville, IL
Something went wrong! Please refresh the page.
| Fire incidents reported | |
|---|---|
| Sreet name | Count |
| COOK AVE | 1,554 |
| MILWAUKEE AVE | 638 |
| PARK AVE | 216 |
| ROCKLAND RD | 164 |
| MILWAUKEE | 158 |
| PETERSON RD | 148 |
| WINCHESTER RD | 104 |
| I-94 EXPY | 102 |
| I94 EXPY | 102 |
| LAKE ST | 88 |
| RT 45 | 82 |
| BUCKLEY RD | 66 |
| ABBOTT PARK RD | 60 |
| GARFIELD AVE | 54 |
| FLORSHEIM DR | 42 |
| GOLF RD | 42 |
| BRADLEY RD | 40 |
| BUTTERFIELD RD | 40 |
| OASIS SERVICE RD | 36 |
| ST.MARY'S RD | 36 |
| OLD SCHOOL RD | 30 |
| CASEY RD | 28 |
| CHURCH ST | 26 |
| DAWES ST | 24 |
| FRANKLIN BLVD | 24 |
| MILWAUKEE AV | 24 |
| VALLEY PARK DR | 24 |
| MUTUAL AID STREET | 22 |
| OAK SPRING LN | 22 |
| COOK | 20 |
2002 - 2018 National Fire Incident Reporting System (NFIRS) incidents
- Incident types reported to NFIRS in Libertyville, IL
- 13,37749.9%Rescue & EMS
- 3,61013.5%False Alarm
- 3,27812.2%Fire
- 2,6419.9%Service Call
- 2,4529.1%Hazardous Condition
- 1,3535.0%Good Intent Call
- 690.3%Overpressure Rupture
- Fire incident types reported to NFIRS in Libertyville, IL
- 2,47975.6%Structure Fires
- 40512.4%Outside Fires
- 3119.5%Mobile Property/Vehicle Fires
- 832.5%Other
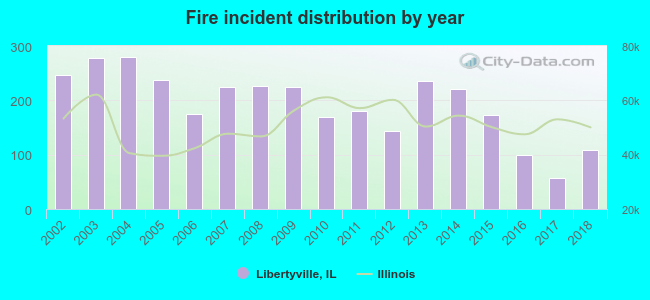 Based on the data from the years 2002 - 2018 the average number of fires per year is 193. The highest number of fire incidents - 280 took place in 2004, and the least - 57 in 2017. The data has a decreasing trend.
The average number of yearly fire incidents per 10k residents in Libertyville, IL compared to nearest cities:
(Note: Based on data for the last 3 years, including only cities with population 5,000 and above)
| Libertyville: | 43.1 |
| Mundelein: | 26.3 |
| Vernon Hills: | 18.4 |
| Gages Lake: | 1.3 |
| Lake Bluff: | 55.0 |
| Grayslake: | 33.6 |
| Park City: | 14.8 |
| North Chicago: | 29.5 |
| Long Grove: | 40.7 |
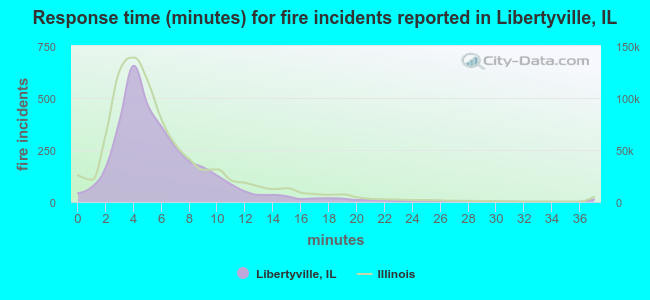 The median response time based on all reported fire incidents is 5 minutes. This is similar to the Illinois median value.
The median response time in Libertyville, IL compared to nearest cities:
(Note: Based on data for all years, including only cities with at least 500 fire incidents)
| Libertyville: | 5 minutes |
| Mundelein: | 5 minutes |
| Vernon Hills: | 5 minutes |
| Lake Bluff: | 5 minutes |
| Grayslake: | 6 minutes |
| North Chicago: | 3 minutes |
| Long Grove: | 7 minutes |
| Gurnee: | 6 minutes |
| Lincolnshire: | 4 minutes |
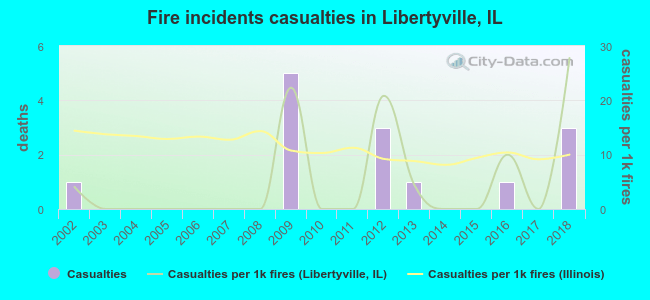 According to the reports from the years 2002 - 2018 the average number of fire-related yearly casualties is 1. The highest number of reported casualties - 5 took place in 2009, and the lowest - 0 in 2003. The data has a rising trend.
The average number of injuries per 1,000 fires is 5. This indicator was the highest - 28 in 2018, and the lowest 0 in 2003. The trend for casualties per 1,000 fire incidents is growing. Compared to the state value the number of casualties per 1,000 fires is much lower.
According to the reports from the years 2002 - 2018 the average number of fire-related yearly casualties is 1. The highest number of reported casualties - 5 took place in 2009, and the lowest - 0 in 2003. The data has a rising trend.
The average number of injuries per 1,000 fires is 5. This indicator was the highest - 28 in 2018, and the lowest 0 in 2003. The trend for casualties per 1,000 fire incidents is growing. Compared to the state value the number of casualties per 1,000 fires is much lower.Casualties per 1,000 incidents in Libertyville, IL compared to nearest cities:
(Note: Based on data for all years, including only cities with at least 500 fire incidents)
| Libertyville: | 4.3 |
| Mundelein: | 10.6 |
| Vernon Hills: | 25.7 |
| Lake Bluff: | 9.5 |
| Grayslake: | 15.9 |
| North Chicago: | 6.9 |
| Long Grove: | 45.5 |
| Gurnee: | 25.4 |
| Lincolnshire: | 8.4 |
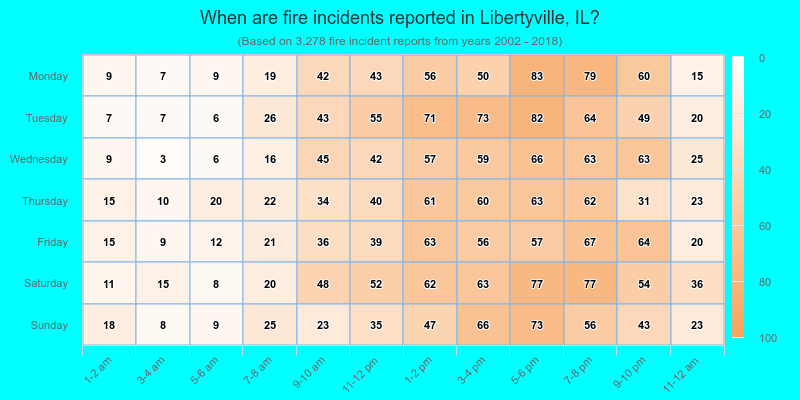
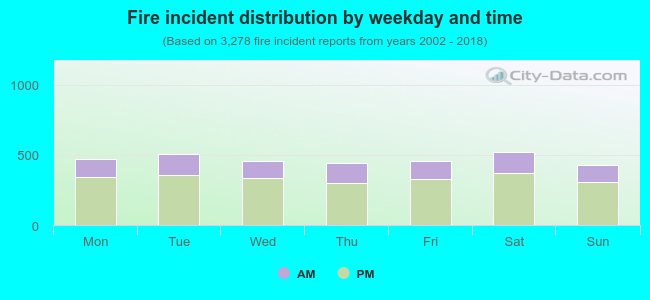 28.6% incidents where reported in the morning and 71.4% in the evening. The most fires (16.0%) took place on Saturday, and the least (13.0%) on Sunday.
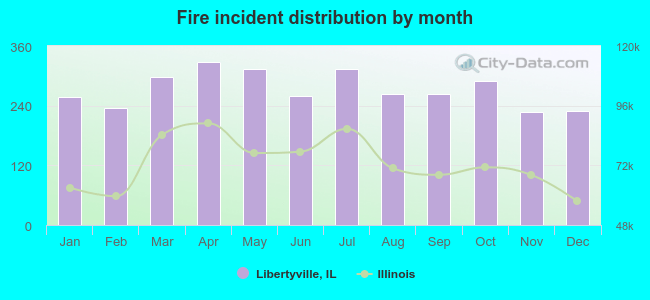 According to the 3,278 fire incident reports from years 2002 - 2018 most fires (10.0%) took place during April, and the least (7.0%) in November.
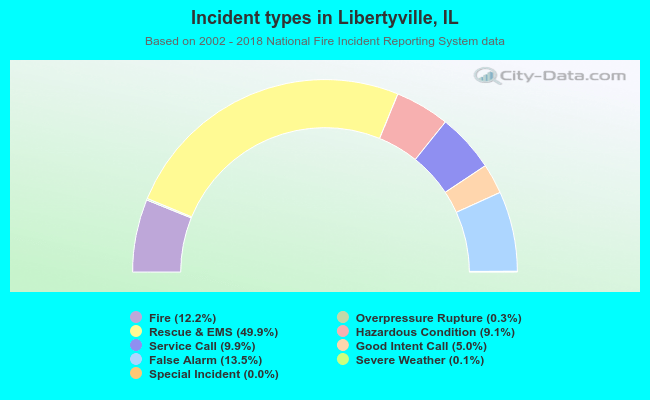 Out of all 26,807 cases reported during the years 2002 - 2018, the most belonged to the categories: Rescue & EMS (49.9%), False Alarm (13.5%), and Fire (12.2%).
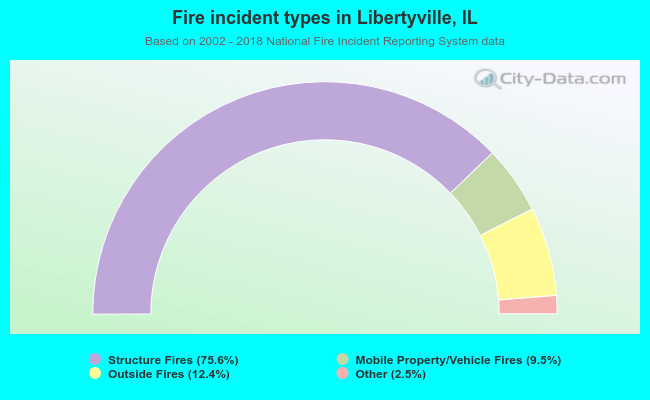 When looking into fire subcategories, the most incidents belonged to: Structure Fires (75.6%), and Outside Fires (12.4%).