North Riverside: Fire Incidents, Illinois (IL)
Where are fire incidents reported in North Riverside, IL
Something went wrong! Please refresh the page.
|
| |||||||||||||||||||||||||||||||||||||||||||||||||||||||||||||||||||||||||||||||||||||||||||||||||||||||||||||
2002 - 2018 National Fire Incident Reporting System (NFIRS) incidents
- Incident types reported to NFIRS in North Riverside, IL
- 5,17752.6%Rescue & EMS
- 1,79618.3%Good Intent Call
- 1,59116.2%False Alarm
- 5625.7%Hazardous Condition
- 4554.6%Service Call
- 2272.3%Fire
- 200.2%Severe Weather
- Fire incident types reported to NFIRS in North Riverside, IL
- 9441.4%Structure Fires
- 9039.6%Outside Fires
- 3314.5%Mobile Property/Vehicle Fires
- 104.4%Other
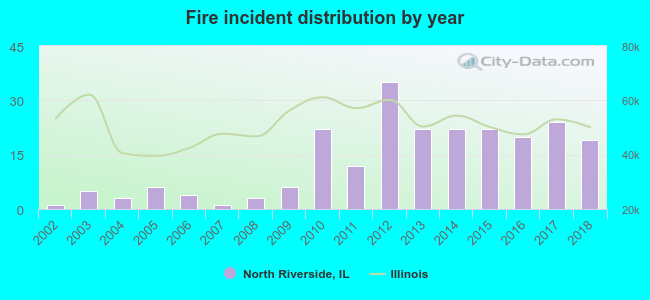 According to the data from the years 2002 - 2018 the average number of fires per year is 13. The highest number of fires - 35 took place in 2012, and the least - 1 in 2002. The data has a growing trend.
The average number of yearly fire incidents per 10k residents in North Riverside, IL compared to nearest cities:
(Note: Based on data for the last 3 years, including only cities with population 5,000 and above)
| North Riverside: | 31.4 |
| Riverside: | 20.6 |
| Broadview: | 57.0 |
| Brookfield: | 36.6 |
| Berwyn: | 23.0 |
| Forest Park: | 45.8 |
| Lyons: | 67.8 |
| La Grange Park: | 15.4 |
| Maywood: | 58.8 |
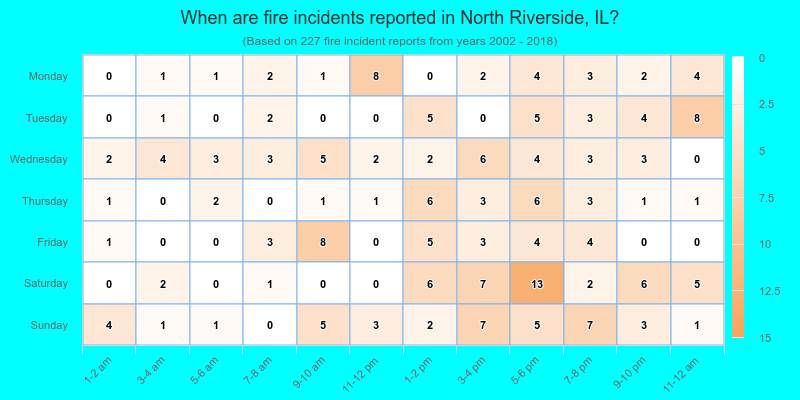
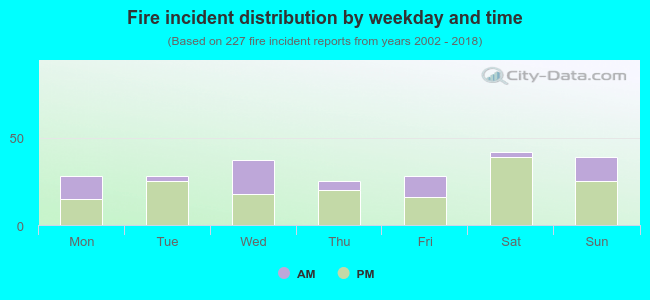 30.4% incidents where reported in the morning and 69.6% in the evening. The most fires (18.5%) took place on Saturday, and the least (11.0%) on Thursday.
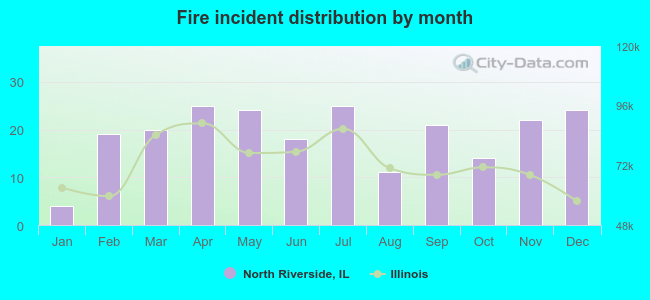 According to the 227 fire incident reports from years 2002 - 2018 most fires (11.0%) took place during April, and the least (1.8%) in January.
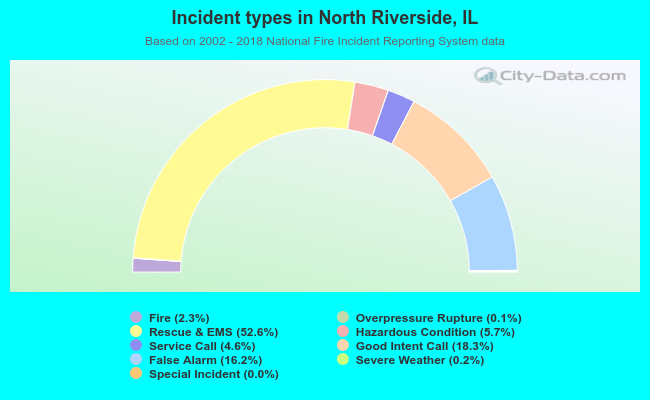 Out of all 9,837 cases reported during the years 2002 - 2018, the most belonged to the categories: Rescue & EMS (52.6%), Good Intent Call (18.3%), and False Alarm (16.2%).
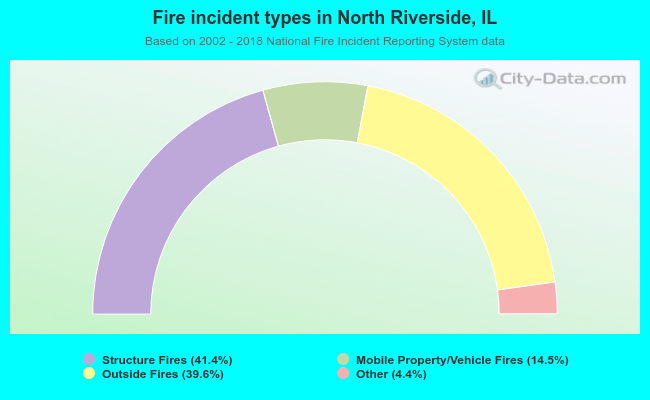 When looking into fire subcategories, the most reports belonged to: Structure Fires (41.4%), and Outside Fires (39.6%).