Forest Park: Fire Incidents, Illinois (IL)
Where are fire incidents reported in Forest Park, IL
Something went wrong! Please refresh the page.
| Fire incidents reported | |
|---|---|
| Sreet name | Count |
| DESPLAINES | 166 |
| ROOSEVELT | 106 |
| CIRCLE | 98 |
| CIRCLE AVE | 90 |
| ELGIN | 78 |
| MARENGO | 68 |
| ROOSEVELT RD | 66 |
| DESPLAINES AVE | 60 |
| HARLEM | 58 |
| LATHROP | 58 |
| BELOIT | 56 |
| HARLEM AVE | 44 |
| MADISON | 40 |
| LATHROP AVE | 38 |
| DES PLAINES AVE | 36 |
| MARENGO AVE | 32 |
| RANDOLPH | 30 |
| DES PLAINES | 28 |
| HANNAH | 28 |
| WASHINGTON | 24 |
| FERDINAND | 20 |
| MONROE | 20 |
| TROOST | 20 |
| I290 HWY | 18 |
| BELOIT AVE | 16 |
| JACKSON | 16 |
| MADISON ST | 16 |
| ADAMS | 14 |
| HARRISON | 14 |
| ROCKFORD | 14 |
2002 - 2018 National Fire Incident Reporting System (NFIRS) incidents
- Incident types reported to NFIRS in Forest Park, IL
- 8,86060.6%Rescue & EMS
- 1,82412.5%Service Call
- 1,58510.8%Good Intent Call
- 8956.1%False Alarm
- 8455.8%Fire
- 6004.1%Hazardous Condition
- Fire incident types reported to NFIRS in Forest Park, IL
- 64876.7%Structure Fires
- 9711.5%Mobile Property/Vehicle Fires
- 9611.4%Outside Fires
- 40.5%Other
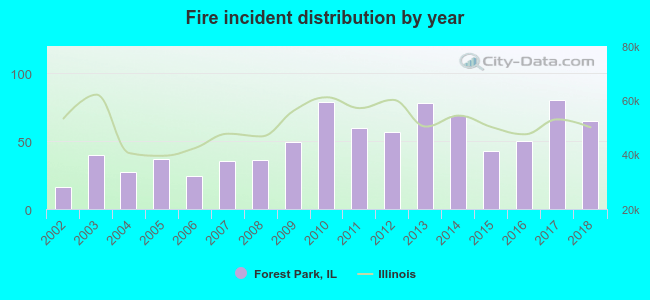 Based on the data from the years 2002 - 2018 the average number of fires per year is 50. The highest number of fire incidents - 80 took place in 2017, and the least - 16 in 2002. The data has a rising trend.
The average number of yearly fire incidents per 10k residents in Forest Park, IL compared to nearest cities:
(Note: Based on data for the last 3 years, including only cities with population 5,000 and above)
| Forest Park: | 45.8 |
| Oak Park: | 26.3 |
| River Forest: | 50.6 |
| Maywood: | 58.8 |
| North Riverside: | 31.4 |
| Berwyn: | 23.0 |
| Broadview: | 57.0 |
| Riverside: | 20.6 |
| Melrose Park: | 35.1 |
 The median response time based on all reported fire incidents is 5 minutes. This is comparable to the state median value.
The median response time in Forest Park, IL compared to nearest cities:
(Note: Based on data for all years, including only cities with at least 500 fire incidents)
| Forest Park: | 5 minutes |
| Oak Park: | 5 minutes |
| River Forest: | 6 minutes |
| Maywood: | 3 minutes |
| Berwyn: | 3 minutes |
| Broadview: | 3 minutes |
| Riverside: | 6 minutes |
| Melrose Park: | 4 minutes |
| Cicero: | 3 minutes |
 According to the data from the years 2002 - 2018 the average number of fire-related yearly casualties is 0. The highest number of reported injuries - 2 took place in 2014, and the lowest - 0 in 2002. The data has a rising trend.
The average number of casualties per 1,000 fires is 6. This indicator was the highest - 29 in 2014, and the lowest 0 in 2002. The trend for injuries per 1,000 fire incidents is growing. Compared to the Illinois value the number of injuries per 1,000 fire incidents is lower.
According to the data from the years 2002 - 2018 the average number of fire-related yearly casualties is 0. The highest number of reported injuries - 2 took place in 2014, and the lowest - 0 in 2002. The data has a rising trend.
The average number of casualties per 1,000 fires is 6. This indicator was the highest - 29 in 2014, and the lowest 0 in 2002. The trend for injuries per 1,000 fire incidents is growing. Compared to the Illinois value the number of injuries per 1,000 fire incidents is lower.Casualties per 1,000 incidents in Forest Park, IL compared to nearest cities:
(Note: Based on data for all years, including only cities with at least 500 fire incidents)
| Forest Park: | 8.3 |
| Oak Park: | 11.2 |
| River Forest: | 5.5 |
| Maywood: | 6.1 |
| Berwyn: | 15.9 |
| Broadview: | 17.9 |
| Riverside: | 11.7 |
| Melrose Park: | 12.3 |
| Cicero: | 13.7 |
 38.1% incidents where reported in the morning and 61.9% in the evening. The most fires (18.2%) took place on Sunday, and the least (11.2%) on Friday.
 According to the 845 reports from years 2002 - 2018 most fires (10.8%) took place during November, and the least (6.3%) in March.
 Out of all 14,624 cases reported during the years 2002 - 2018, the most belonged to the categories: Rescue & EMS (60.6%), Service Call (12.5%), and Good Intent Call (10.8%).
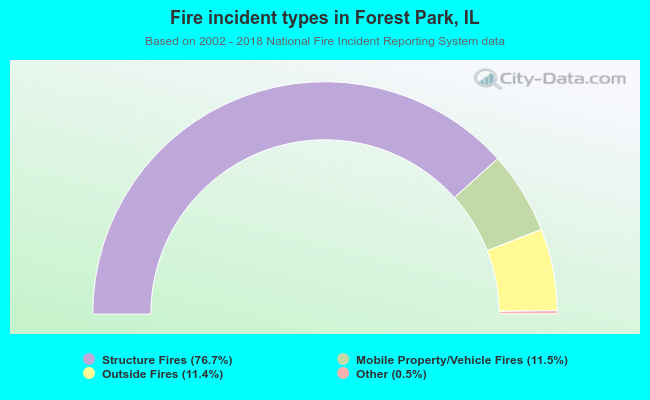 When looking into fire subcategories, the most incidents belonged to: Structure Fires (76.7%), and Mobile Property/Vehicle Fires (11.5%).