Northlake: Fire Incidents, Illinois (IL)
Where are fire incidents reported in Northlake, IL
Something went wrong! Please refresh the page.
| Fire incidents reported | |
|---|---|
| Sreet name | Count |
| LAKE ST | 254 |
| NORTH AVE | 232 |
| WOLF RD | 132 |
| GRAND AVE | 86 |
| KING ARTHUR CT | 76 |
| MANNHEIM RD | 64 |
| PALMER AVE | 60 |
| NORTHWEST AVE | 52 |
| MEDILL AVE | 44 |
| ROY AVE | 34 |
| WOLF | 34 |
| GOLFVIEW DR | 32 |
| NORTH | 32 |
| DICKENS | 26 |
| LAKE | 26 |
| WOLF AVE | 26 |
| DICKENS AVE | 24 |
| RAILROAD AVE | 24 |
| I294 TWY | 22 |
| LA PORTE AVE | 22 |
| LYNDALE AVE | 22 |
| MAJOR DR | 22 |
| KING ARTHUR CT | 20 |
| 43RD AVE | 18 |
| ARMITAGE AVE | 18 |
| DEWEY AVE | 18 |
| FULLERTON AVE | 18 |
| I294 | 18 |
| KING ARTHUR PKY | 18 |
| MAJOR | 18 |
2002 - 2018 National Fire Incident Reporting System (NFIRS) incidents
- Incident types reported to NFIRS in Northlake, IL
- 8,89857.4%Rescue & EMS
- 2,18914.1%False Alarm
- 1,2718.2%Fire
- 1,1927.7%Good Intent Call
- 1,0546.8%Hazardous Condition
- 8545.5%Service Call
- 170.1%Special Incident
- Fire incident types reported to NFIRS in Northlake, IL
- 66852.6%Structure Fires
- 24018.9%Outside Fires
- 20115.8%Mobile Property/Vehicle Fires
- 16212.7%Other
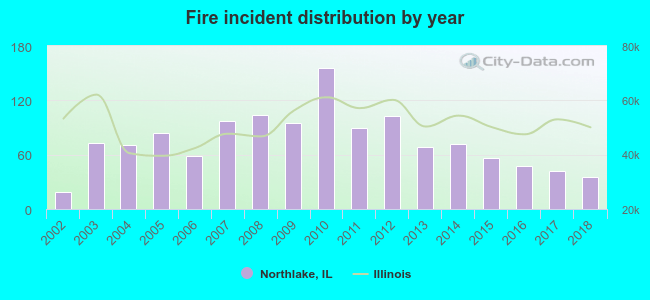 Based on the data from the years 2002 - 2018 the average number of fire incidents per year is 75. The highest number of fire incidents - 156 took place in 2010, and the least - 19 in 2002. The data has a rising trend.
The average number of yearly fire incidents per 10k residents in Northlake, IL compared to nearest cities:
(Note: Based on data for the last 3 years, including only cities with population 5,000 and above)
| Northlake: | 33.7 |
| Berkeley: | 82.2 |
| Franklin Park: | 39.5 |
| Melrose Park: | 35.1 |
| Bellwood: | 43.3 |
| Hillside: | 67.1 |
| Elmhurst: | 18.9 |
| River Grove: | 29.2 |
| Schiller Park: | 49.5 |
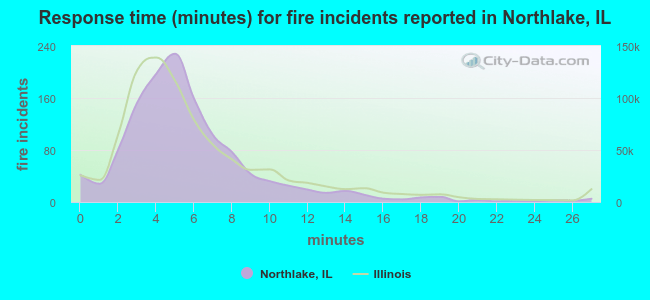 The median response time based on all reported fire incidents is 5 minutes. This is comparable to the Illinois median value.
The median response time in Northlake, IL compared to nearest cities:
(Note: Based on data for all years, including only cities with at least 500 fire incidents)
| Northlake: | 5 minutes |
| Berkeley: | 4 minutes |
| Franklin Park: | 4 minutes |
| Melrose Park: | 4 minutes |
| Bellwood: | 3 minutes |
| Hillside: | 4 minutes |
| Elmhurst: | 5 minutes |
| River Grove: | 4 minutes |
| Schiller Park: | 4 minutes |
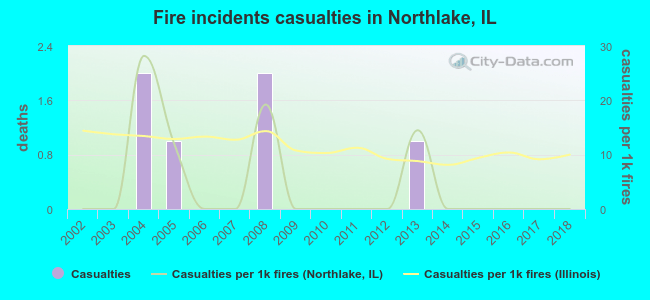 According to the data from the years 2002 - 2018 the average number of fire-related casualties per year is 0. The highest number of reported casualties - 2 took place in 2004, and the lowest - 0 in 2002. The data has a constant trend.
The average number of casualties per 1,000 fire incidents is 4. This indicator was the highest - 28 in 2004, and the lowest 0 in 2002. The trend for injuries per 1,000 fires is constant. Compared to the state value the number of injuries per 1,000 fire incidents is much lower.
According to the data from the years 2002 - 2018 the average number of fire-related casualties per year is 0. The highest number of reported casualties - 2 took place in 2004, and the lowest - 0 in 2002. The data has a constant trend.
The average number of casualties per 1,000 fire incidents is 4. This indicator was the highest - 28 in 2004, and the lowest 0 in 2002. The trend for injuries per 1,000 fires is constant. Compared to the state value the number of injuries per 1,000 fire incidents is much lower.Casualties per 1,000 incidents in Northlake, IL compared to nearest cities:
(Note: Based on data for all years, including only cities with at least 500 fire incidents)
| Northlake: | 4.7 |
| Berkeley: | 7.5 |
| Franklin Park: | 15.4 |
| Melrose Park: | 12.3 |
| Bellwood: | 5.1 |
| Hillside: | 17.0 |
| Elmhurst: | 9.7 |
| River Grove: | 3.1 |
| Schiller Park: | 8.6 |
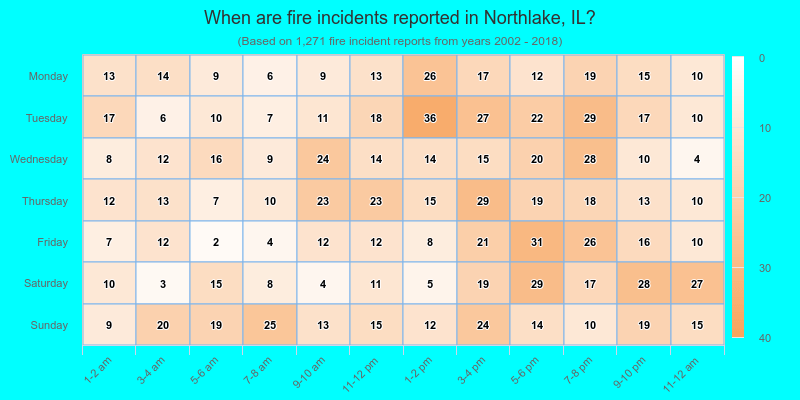
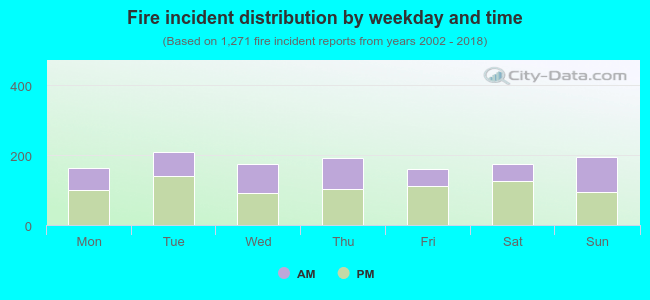 39.7% incidents where reported in the morning and 60.3% in the evening. The most fires (16.5%) took place on Tuesday, and the least (12.7%) on Friday.
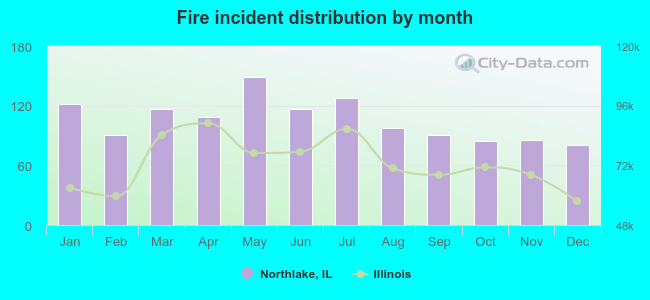 Based on the 1,271 fires from years 2002 - 2018 most fires (11.7%) took place during May, and the least (6.3%) in December.
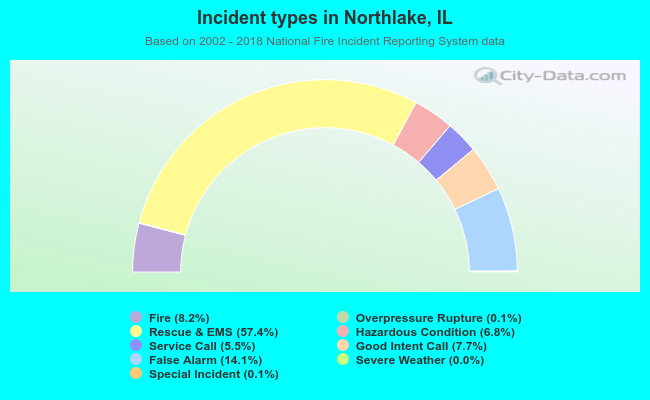 Out of all 15,491 cases reported during the years 2002 - 2018, the most belonged to the categories: Rescue & EMS (57.4%), False Alarm (14.1%), and Fire (8.2%).
 When looking into fire subcategories, the most incidents belonged to: Structure Fires (52.6%), and Outside Fires (18.9%).