Olney: Fire Incidents, Illinois (IL)
Where are fire incidents reported in Olney, IL
Something went wrong! Please refresh the page.
| Fire incidents reported | |
|---|---|
| Sreet name | Count |
| WEST ST | 108 |
| MAIN ST | 82 |
| EAST ST | 58 |
| NORTH ST | 48 |
| CAMP ST | 42 |
| ILLINOIS ROUTE 130 | 38 |
| ELM ST | 36 |
| SOUTH ST | 36 |
| CHERRY ST | 34 |
| MACK AVE | 32 |
| CHESTNUT ST | 30 |
| WHITTLE AVE | 30 |
| BUTLER ST | 28 |
| MT. PLEASANT (0800N) LANE | 28 |
| BALTIMORE ST | 24 |
| MORGAN ST | 20 |
| LAFAYETTE ST | 18 |
| SHIPLEY RD | 18 |
| IL ROUTE 130 | 16 |
| LAUREL ST | 16 |
| LEXINGTON ST | 16 |
| SCOTT ST | 16 |
| ST. MARIE (1400E) RD | 16 |
| WATERGATE (1360E) RD | 16 |
| HOLLY RD | 14 |
| IL 250 | 14 |
| JEFFERSON ST | 14 |
| LINCOLN ST | 14 |
| PINE ST | 14 |
| SARATOGA ST | 14 |
| Other | 172 |
2002 - 2018 National Fire Incident Reporting System (NFIRS) incidents
- Incident types reported to NFIRS in Olney, IL
- 1,06242.8%Fire
- 82633.3%Hazardous Condition
- 2359.5%False Alarm
- 1375.5%Rescue & EMS
- 1104.4%Service Call
- 1034.1%Good Intent Call
- 50.2%Severe Weather
- 30.1%Special Incident
- Fire incident types reported to NFIRS in Olney, IL
- 46543.8%Structure Fires
- 39136.8%Outside Fires
- 17516.5%Mobile Property/Vehicle Fires
- 312.9%Other
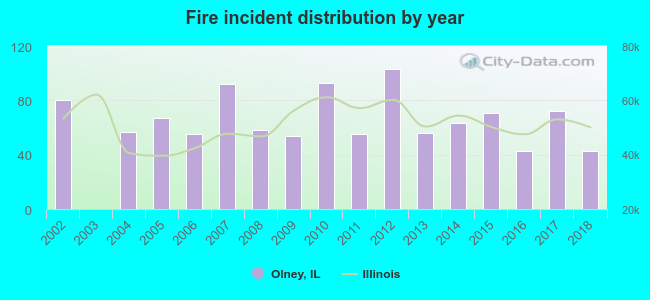 According to the data from the years 2002 - 2018 the average number of fire incidents per year is 62. The highest number of fire incidents - 103 took place in 2012, and the least - 0 in 2003. The data has a declining trend.
The average number of yearly fire incidents per 10k residents in Olney, IL compared to nearest cities:
(Note: Based on data for the last 3 years, including only cities with population 5,000 and above)
| Olney: | 58.3 |
| Robinson: | 61.2 |
| Mount Carmel: | 16.6 |
| Fairfield: | 74.8 |
| Effingham: | 83.2 |
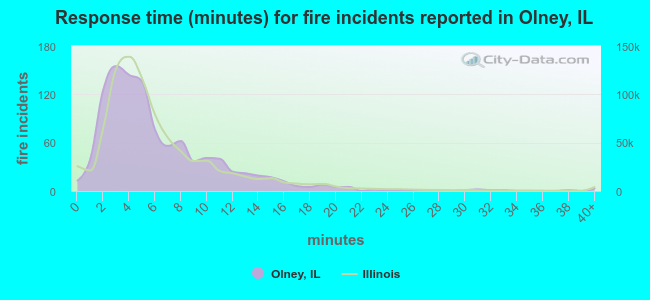 The median response time based on all reported fire incidents is 5 minutes. This is comparable to the state median value.
The median response time in Olney, IL compared to nearest cities:
(Note: Based on data for all years, including only cities with at least 500 fire incidents)
| Olney: | 5 minutes |
| Newton: | 7 minutes |
| Lawrenceville: | 10 minutes |
| Robinson: | 7 minutes |
| Fairfield: | 6 minutes |
| Effingham: | 4 minutes |
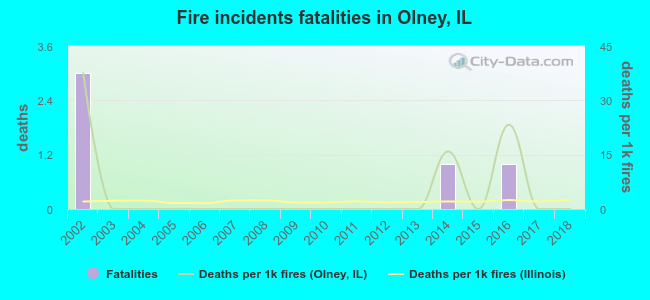 Based on the reports from the years 2002 - 2018 the average number of fire-related fatalities per year is 0. The highest number of deaths - 3 took place in 2002, and the lowest - 0 in 2003. The data has a decreasing trend.
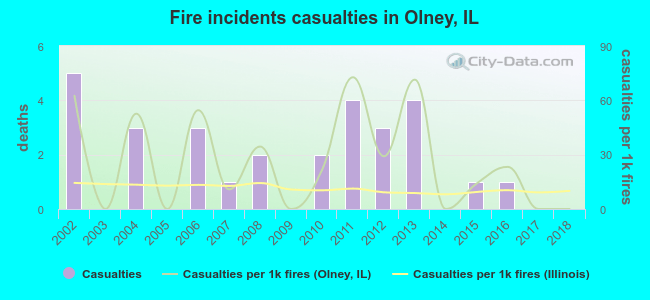 According to the reports from the years 2002 - 2018 the average number of fire-related casualties per year is 2. The highest number of injuries - 5 took place in 2002, and the lowest - 0 in 2003. The data has a dropping trend.
The average number of injuries per 1,000 fire incidents is 26. This indicator was the highest - 73 in 2011, and the lowest 0 in 2003. The trend for casualties per 1,000 incidents is declining. Compared to the Illinois value the number of injuries per 1,000 fire incidents is much higher.
According to the reports from the years 2002 - 2018 the average number of fire-related casualties per year is 2. The highest number of injuries - 5 took place in 2002, and the lowest - 0 in 2003. The data has a dropping trend.
The average number of injuries per 1,000 fire incidents is 26. This indicator was the highest - 73 in 2011, and the lowest 0 in 2003. The trend for casualties per 1,000 incidents is declining. Compared to the Illinois value the number of injuries per 1,000 fire incidents is much higher.Casualties per 1,000 incidents in Olney, IL compared to nearest cities:
(Note: Based on data for all years, including only cities with at least 500 fire incidents)
| Olney: | 27.3 |
| Newton: | 14.9 |
| Lawrenceville: | 2.2 |
| Robinson: | 10.7 |
| Fairfield: | 0.0 |
| Effingham: | 10.8 |
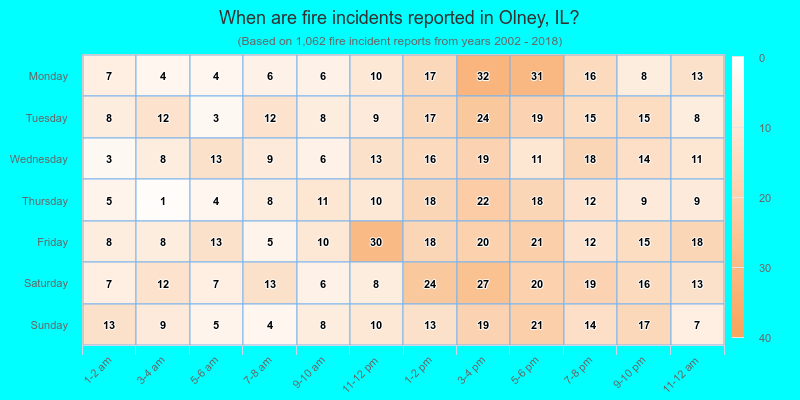
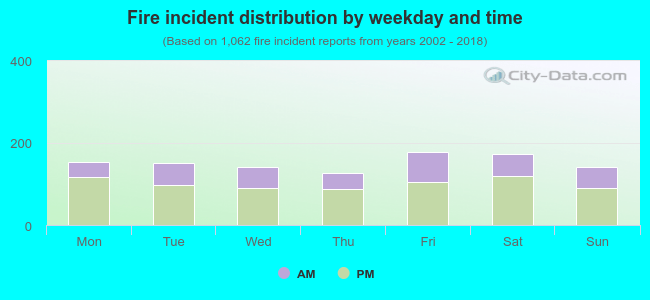 33.5% incidents where reported in the morning and 66.5% in the evening. The most fires (16.8%) took place on Friday, and the least (12.0%) on Thursday.
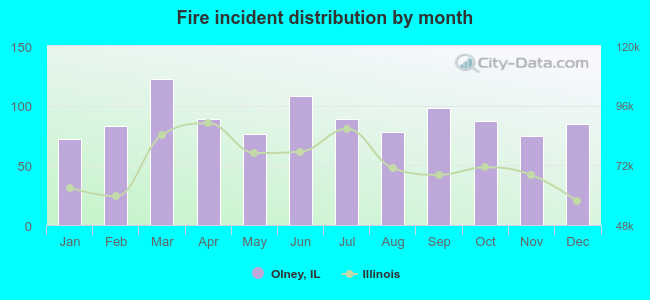 Based on the 1,062 reports from years 2002 - 2018 most fires (11.5%) took place during March, and the least (6.8%) in January.
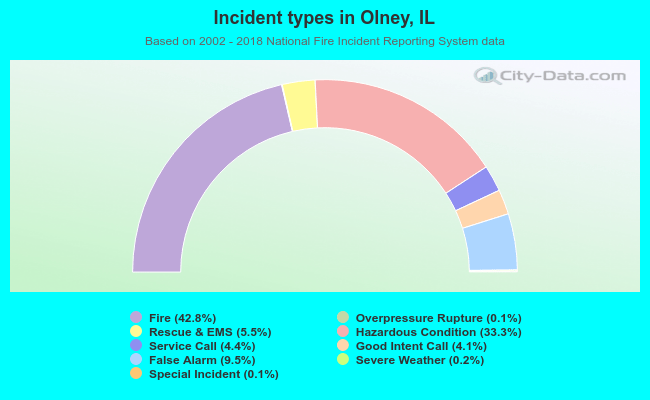 Out of all 2,483 cases reported during the years 2002 - 2018, the most belonged to the categories: Fire (42.8%), Hazardous Condition (33.3%), and False Alarm (9.5%).
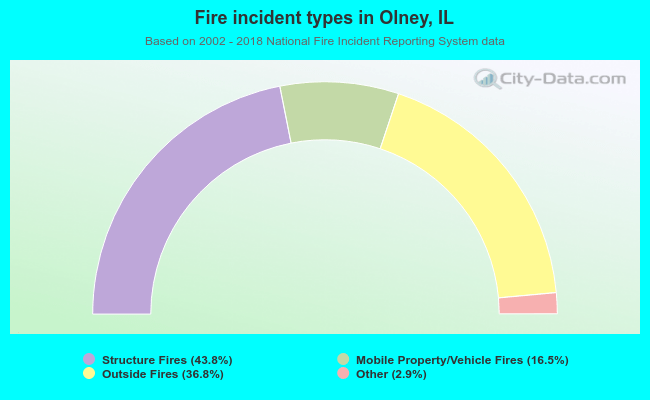 When looking into fire subcategories, the most incidents belonged to: Structure Fires (43.8%), and Outside Fires (36.8%).