Robinson: Fire Incidents, Illinois (IL)
Where are fire incidents reported in Robinson, IL
Something went wrong! Please refresh the page.
| Fire incidents reported | |
|---|---|
| Sreet name | Count |
| MAIN ST | 108 |
| 1050TH AVE | 68 |
| PINE ST | 58 |
| CROSS ST | 50 |
| 700TH AVE | 46 |
| JACKSON ST | 38 |
| WALNUT ST | 38 |
| 900TH AVE | 26 |
| JEFFERSON ST | 26 |
| STEEL ST | 24 |
| FRANKLIN ST | 22 |
| 1050TH ST | 20 |
| HOWARD ST | 20 |
| MYERS ST | 20 |
| TRIMBLE RD | 20 |
| 600TH ST | 18 |
| 800TH AVE | 18 |
| LINCOLN ST | 18 |
| MARATHON AVE | 18 |
| 1150TH AVE | 16 |
| 725TH ST | 16 |
| 800TH ST | 16 |
| LAKEVIEW DR | 16 |
| ROBB ST | 16 |
| 650TH ST | 14 |
| 950TH AVE | 14 |
| ALLEN ST | 14 |
| KING ST | 14 |
| STATE 1 HWY | 14 |
| 1100TH ST | 12 |
| Other | 119 |
2002 - 2018 National Fire Incident Reporting System (NFIRS) incidents
- Incident types reported to NFIRS in Robinson, IL
- 93740.2%Fire
- 54423.3%Hazardous Condition
- 39216.8%Rescue & EMS
- 2038.7%Good Intent Call
- 1817.8%False Alarm
- 512.2%Service Call
- 150.6%Severe Weather
- 70.3%Special Incident
- 30.1%Overpressure Rupture
- Fire incident types reported to NFIRS in Robinson, IL
- 48151.3%Structure Fires
- 33635.9%Outside Fires
- 9410.0%Mobile Property/Vehicle Fires
- 262.8%Other
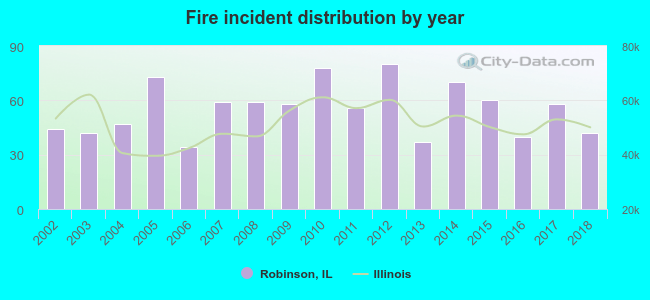 According to the data from the years 2002 - 2018 the average number of fire incidents per year is 55. The highest number of fires - 80 took place in 2012, and the least - 34 in 2006. The data has a decreasing trend.
The average number of yearly fire incidents per 10k residents in Robinson, IL compared to nearest cities:
(Note: Based on data for the last 3 years, including only cities with population 5,000 and above)
| Robinson: | 61.2 |
| Olney: | 58.3 |
 The median response time based on all reported fire incidents is 7 minutes. This is higher compared to the state median value.
The median response time in Robinson, IL compared to nearest cities:
(Note: Based on data for all years, including only cities with at least 500 fire incidents)
| Robinson: | 7 minutes |
| Lawrenceville: | 10 minutes |
| Newton: | 7 minutes |
| Olney: | 5 minutes |
| Marshall: | 9 minutes |
 Based on the reports from the years 2002 - 2018 the average number of fire-related yearly casualties is 1. The highest number of reported casualties - 3 took place in 2007, and the lowest - 0 in 2003. The data has a decreasing trend.
The average number of injuries per 1,000 fires is 11. This indicator was the highest - 54 in 2013, and the lowest 0 in 2003. The trend for injuries per 1,000 fire incidents is declining. Compared to the Illinois value the number of casualties per 1,000 fires is similar.
Based on the reports from the years 2002 - 2018 the average number of fire-related yearly casualties is 1. The highest number of reported casualties - 3 took place in 2007, and the lowest - 0 in 2003. The data has a decreasing trend.
The average number of injuries per 1,000 fires is 11. This indicator was the highest - 54 in 2013, and the lowest 0 in 2003. The trend for injuries per 1,000 fire incidents is declining. Compared to the Illinois value the number of casualties per 1,000 fires is similar.Casualties per 1,000 incidents in Robinson, IL compared to nearest cities:
(Note: Based on data for all years, including only cities with at least 500 fire incidents)
| Robinson: | 10.7 |
| Lawrenceville: | 2.2 |
| Newton: | 14.9 |
| Olney: | 27.3 |
| Marshall: | 5.1 |
 30.7% incidents where reported in the morning and 69.3% in the evening. The most fires (16.2%) took place on Wednesday, and the least (12.6%) on Saturday.
 According to the 937 fire incidents from years 2002 - 2018 most fires (11.8%) took place during March, and the least (5.0%) in May.
 Out of all 2,333 cases reported during the years 2002 - 2018, the most belonged to the categories: Fire (40.2%), Hazardous Condition (23.3%), and Rescue & EMS (16.8%).
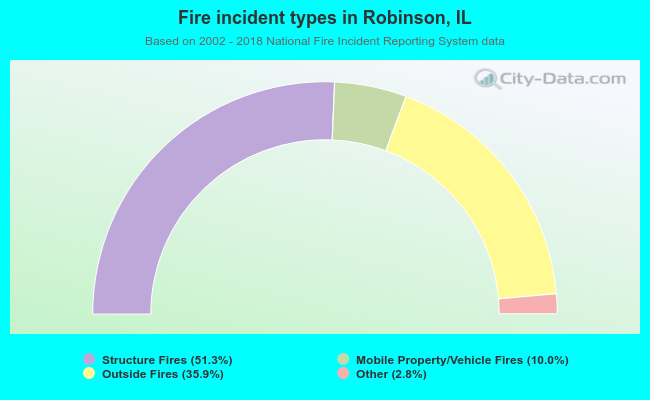 When looking into fire subcategories, the most incidents belonged to: Structure Fires (51.3%), and Outside Fires (35.9%).