Opelousas: Fire Incidents, Louisiana (LA)
Where are fire incidents reported in Opelousas, LA
Something went wrong! Please refresh the page.
| Fire incidents reported | |
|---|---|
| Sreet name | Count |
| HWY 190 | 172 |
| HWY 167 | 164 |
| HWY 182 | 164 |
| I49 | 132 |
| I-49 | 90 |
| MAIN ST | 78 |
| UNION ST | 78 |
| HWY 103 | 76 |
| HWY 749 | 74 |
| LANDRY ST | 72 |
| HWY 357 | 70 |
| PERRY LANE | 70 |
| HWY 31 | 66 |
| HWY 178 | 64 |
| CRESWELL LANE | 58 |
| GROLEE ST | 58 |
| HWY 3043 | 58 |
| PRAIRIE RHONDE HWY | 54 |
| MAIN | 52 |
| HWY 104 | 50 |
| MILLER RD | 50 |
| HWY 358 | 48 |
| COUNTRY RIDGE RD | 46 |
| GARLAND AVE | 46 |
| DUPRE RD | 38 |
| SOUTH ST | 38 |
| VINE ST | 38 |
| WASHINGTON ST | 36 |
| AUSTIN RD | 34 |
| RAILROAD AVE | 34 |
| Other | 2,186 |
2002 - 2018 National Fire Incident Reporting System (NFIRS) incidents
- Incident types reported to NFIRS in Opelousas, LA
- 4,29445.1%Fire
- 1,99721.0%Hazardous Condition
- 1,41614.9%False Alarm
- 1,00310.5%Good Intent Call
- 3834.0%Service Call
- 3413.6%Rescue & EMS
- 640.7%Overpressure Rupture
- 110.1%Special Incident
- Fire incident types reported to NFIRS in Opelousas, LA
- 2,08148.5%Outside Fires
- 1,33631.1%Structure Fires
- 77118.0%Mobile Property/Vehicle Fires
- 1062.5%Other
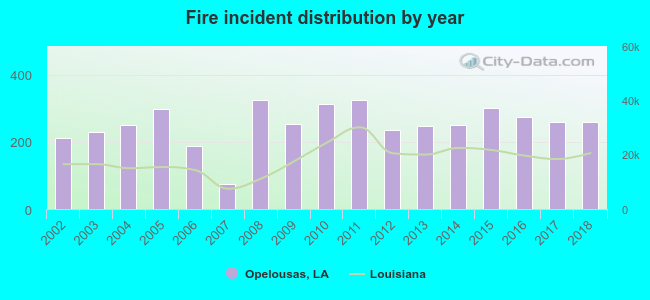 Based on the data from the years 2002 - 2018 the average number of fire incidents per year is 253. The highest number of reported fire incidents - 324 took place in 2008, and the least - 76 in 2007. The data has a rising trend.
The average number of yearly fire incidents per 10k residents in Opelousas, LA compared to nearest cities:
(Note: Based on data for the last 3 years, including only cities with population 5,000 and above)
| Opelousas: | 158.9 |
| Carencro: | 113.6 |
| Ville Platte: | 100.2 |
| Eunice: | 91.6 |
| Scott: | 94.7 |
| Breaux Bridge: | 124.5 |
| Lafayette: | 36.2 |
| Rayne: | 54.3 |
| Broussard: | 79.8 |
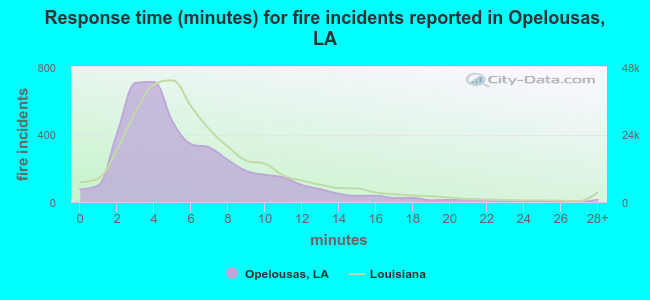 The median response time based on all reported fire incidents is 5 minutes. This is lower than the state median value.
The median response time in Opelousas, LA compared to nearest cities:
(Note: Based on data for all years, including only cities with at least 500 fire incidents)
| Opelousas: | 5 minutes |
| Church Point: | 7 minutes |
| Arnaudville: | 11 minutes |
| Carencro: | 8 minutes |
| Ville Platte: | 5 minutes |
| Eunice: | 4 minutes |
| Scott: | 9 minutes |
| Breaux Bridge: | 11 minutes |
| Duson: | 8 minutes |
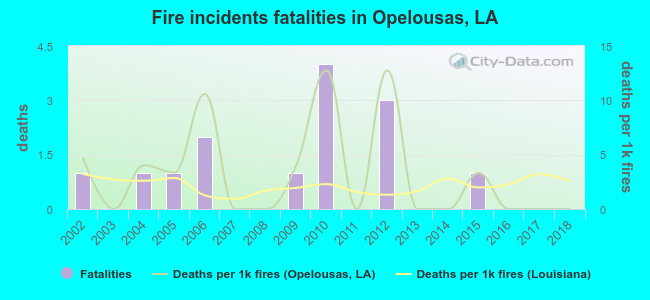 Based on the data from the years 2002 - 2018 the average number of fire-related yearly deaths is 1. The highest number of deaths - 4 took place in 2010, and the lowest - 0 in 2003. The data has a dropping trend.
The average number of fatalities per 1,000 fires is 3. This indicator was the highest - 13 in 2012, and the lowest 0 in 2003. The trend for fatalities per 1,000 fires is dropping. Compared to the Louisiana value the number of deaths per 1,000 fires is higher.
Based on the data from the years 2002 - 2018 the average number of fire-related yearly deaths is 1. The highest number of deaths - 4 took place in 2010, and the lowest - 0 in 2003. The data has a dropping trend.
The average number of fatalities per 1,000 fires is 3. This indicator was the highest - 13 in 2012, and the lowest 0 in 2003. The trend for fatalities per 1,000 fires is dropping. Compared to the Louisiana value the number of deaths per 1,000 fires is higher.Deaths per 1,000 incidents in Opelousas, LA compared to nearest cities:
(Note: Based on data for all years, including only cities with at least 2,500 fire incidents)
| Opelousas: | 3.3 |
| Lafayette: | 3.6 |
| New Iberia: | 2.1 |
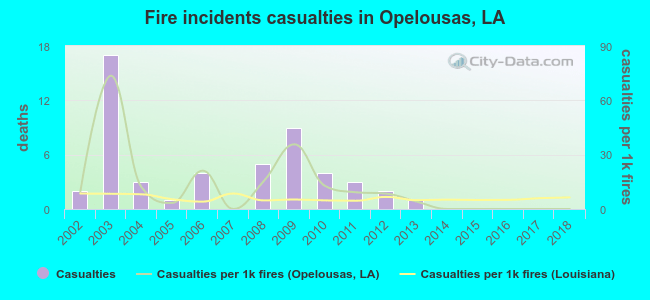 Based on the reports from the years 2002 - 2018 the average number of fire-related casualties per year is 3. The highest number of injuries - 17 took place in 2003, and the lowest - 0 in 2007. The data has a dropping trend.
The average number of injuries per 1,000 fires is 12. This indicator was the highest - 74 in 2003, and the lowest 0 in 2007. The trend for injuries per 1,000 incidents is dropping. Compared to the Louisiana value the number of casualties per 1,000 fire incidents is much higher.
Based on the reports from the years 2002 - 2018 the average number of fire-related casualties per year is 3. The highest number of injuries - 17 took place in 2003, and the lowest - 0 in 2007. The data has a dropping trend.
The average number of injuries per 1,000 fires is 12. This indicator was the highest - 74 in 2003, and the lowest 0 in 2007. The trend for injuries per 1,000 incidents is dropping. Compared to the Louisiana value the number of casualties per 1,000 fire incidents is much higher.Casualties per 1,000 incidents in Opelousas, LA compared to nearest cities:
(Note: Based on data for all years, including only cities with at least 500 fire incidents)
| Opelousas: | 11.9 |
| Church Point: | 0.0 |
| Arnaudville: | 0.0 |
| Carencro: | 0.0 |
| Ville Platte: | 1.0 |
| Eunice: | 13.9 |
| Scott: | 4.3 |
| Breaux Bridge: | 1.8 |
| Duson: | 0.0 |
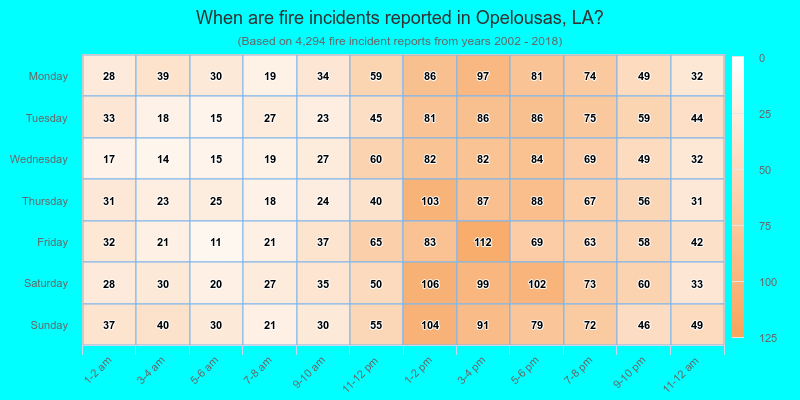
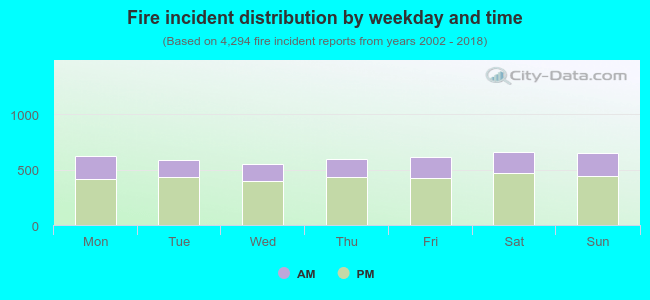 29.6% incidents where reported in the morning and 70.4% in the evening. The most fires (15.4%) took place on Saturday, and the least (12.8%) on Wednesday.
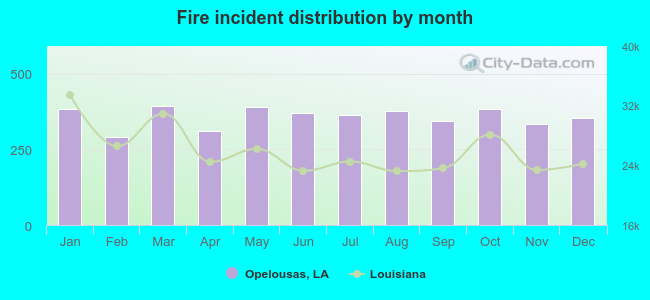 According to the 4,294 incident reports from years 2002 - 2018 most fires (9.2%) took place during March, and the least (6.8%) in February.
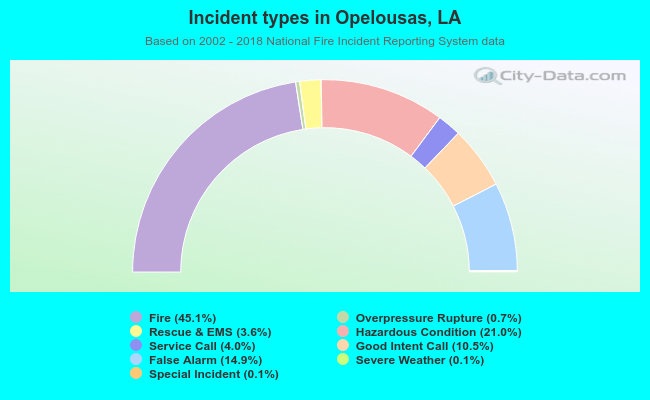 Out of all 9,518 cases reported during the years 2002 - 2018, the most belonged to the categories: Fire (45.1%), Hazardous Condition (21.0%), and False Alarm (14.9%).
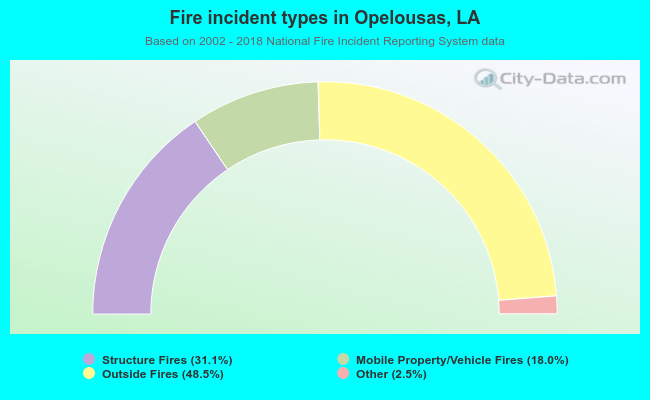 When looking into fire subcategories, the most incidents belonged to: Outside Fires (48.5%), and Structure Fires (31.1%).