Opp: Fire Incidents, Alabama (AL)
Where are fire incidents reported in Opp, AL
Something went wrong! Please refresh the page.
|
| |||||||||||||||||||||||||||||||||||||||||||||||||||||||||||||||||||||||||||||||||||||||||||||||||||||||||||||
2003 - 2018 National Fire Incident Reporting System (NFIRS) incidents
- Incident types reported to NFIRS in Opp, AL
- 2,75148.2%Rescue & EMS
- 99717.5%Fire
- 80914.2%Hazardous Condition
- 5129.0%Service Call
- 2855.0%False Alarm
- 1853.2%Special Incident
- 1522.7%Good Intent Call
- 190.3%Severe Weather
- Fire incident types reported to NFIRS in Opp, AL
- 45245.3%Outside Fires
- 37337.4%Structure Fires
- 12712.7%Mobile Property/Vehicle Fires
- 454.5%Other
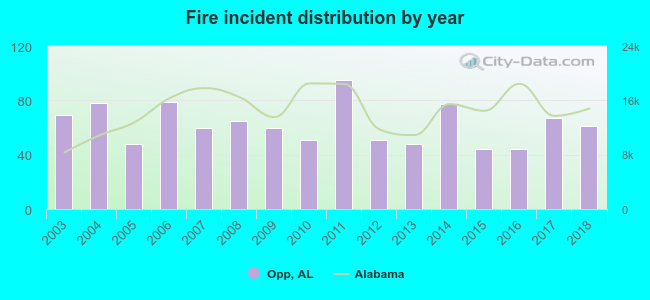 According to the data from the years 2003 - 2018 the average number of fire incidents per year is 62. The highest number of fires - 95 took place in 2011, and the least - 44 in 2015. The data has a declining trend.
The average number of yearly fire incidents per 10k residents in Opp, AL compared to nearest cities:
(Note: Based on data for the last 3 years, including only cities with population 5,000 and above)
| Opp: | 85.9 |
| Andalusia: | 19.1 |
| Enterprise: | 34.8 |
| Daleville: | 16.9 |
| Ozark: | 43.5 |
| Troy: | 51.4 |
| Greenville: | 81.8 |
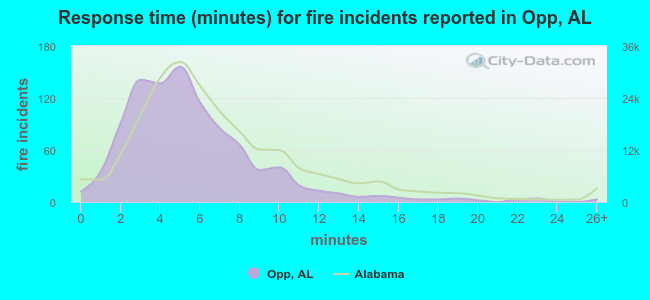 The median response time based on all reported fire incidents is 5 minutes. This is lower than the state median value.
The median response time in Opp, AL compared to nearest cities:
(Note: Based on data for all years, including only cities with at least 500 fire incidents)
| Opp: | 5 minutes |
| Samson: | 10 minutes |
| Enterprise: | 4 minutes |
| Geneva: | 9 minutes |
| Ozark: | 5 minutes |
| Troy: | 5 minutes |
| Evergreen: | 10 minutes |
| Greenville: | 6 minutes |
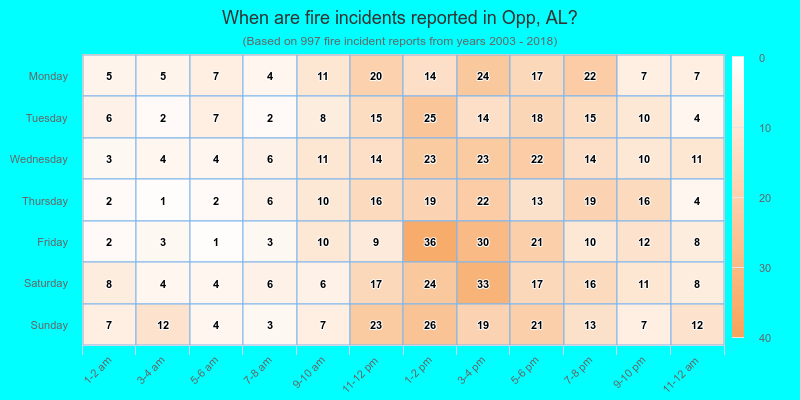
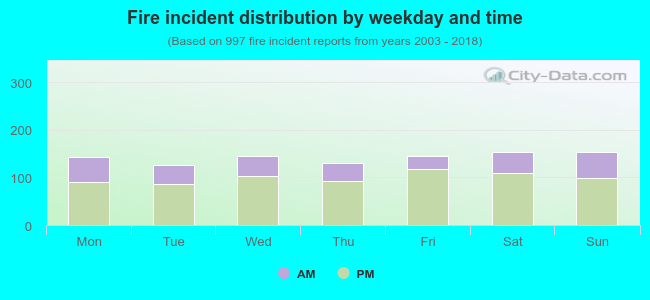 30.1% incidents where reported in the morning and 69.9% in the evening. The most fires (15.4%) took place on Saturday, and the least (12.6%) on Tuesday.
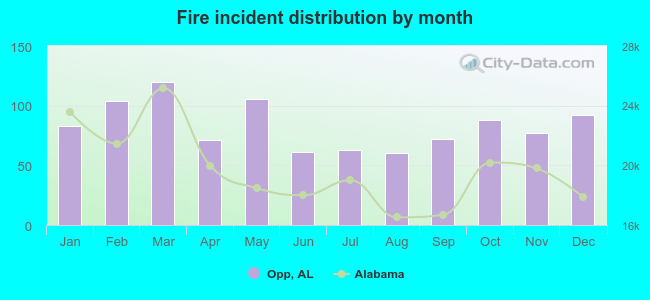 According to the 997 incident reports from years 2003 - 2018 most fires (12.0%) took place during March, and the least (6.0%) in August.
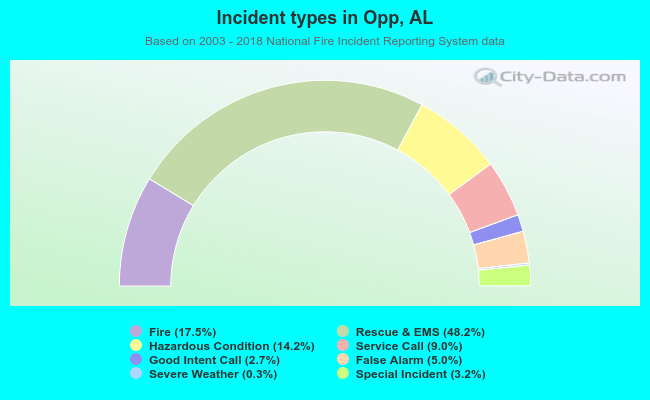 Out of all 5,710 cases reported during the years 2003 - 2018, the most belonged to the categories: Overpressure Rupture (48.2%), Fire (17.5%), and Rescue & EMS (14.2%).
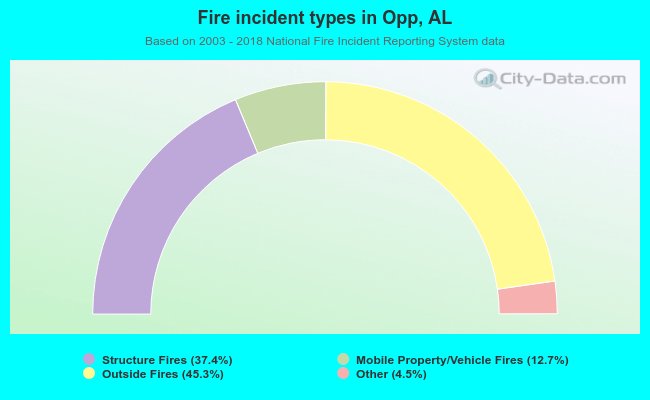 When looking into fire subcategories, the most incidents belonged to: Outside Fires (45.3%), and Structure Fires (37.4%).