Oregon: Fire Incidents, Wisconsin (WI)
Where are fire incidents reported in Oregon, WI
Something went wrong! Please refresh the page.
|
| |||||||||||||||||||||||||||||||||||||||||||||||||||||||||||||||||||||||||||||||||||||||||||||||||||||||||||||
2003 - 2018 National Fire Incident Reporting System (NFIRS) incidents
- Incident types reported to NFIRS in Oregon, WI
- 1,39350.4%Rescue & EMS
- 41014.8%Fire
- 35312.8%Good Intent Call
- 2649.5%Hazardous Condition
- 2559.2%False Alarm
- 802.9%Service Call
- 80.3%Special Incident
- Fire incident types reported to NFIRS in Oregon, WI
- 21752.9%Structure Fires
- 14334.9%Outside Fires
- 307.3%Mobile Property/Vehicle Fires
- 204.9%Other
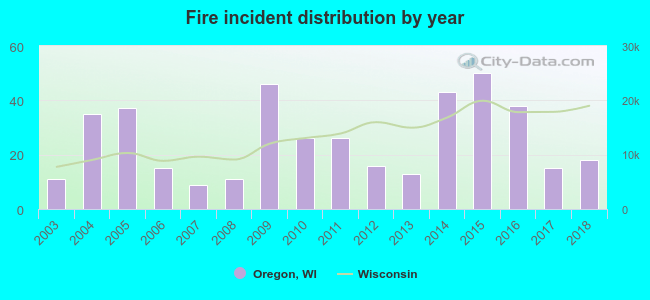 Based on the data from the years 2003 - 2018 the average number of fire incidents per year is 26. The highest number of reported fires - 50 took place in 2015, and the least - 9 in 2007. The data has an increasing trend.
The average number of yearly fire incidents per 10k residents in Oregon, WI compared to nearest cities:
(Note: Based on data for the last 3 years, including only cities with population 5,000 and above)
| Oregon: | 24.0 |
| Fitchburg: | 33.1 |
| Stoughton: | 46.8 |
| McFarland: | 33.0 |
| Verona: | 27.8 |
| Monona: | 25.4 |
| Madison: | 8.6 |
| Evansville: | 63.1 |
| Middleton: | 24.1 |

 27.3% incidents where reported in the morning and 72.7% in the evening. The most fires (18.5%) took place on Saturday, and the least (11.7%) on Thursday.
 Based on the 410 fire incident reports from years 2003 - 2018 most fires (13.4%) took place during April, and the least (4.9%) in August.
 Out of all 2,766 cases reported during the years 2003 - 2018, the most belonged to the categories: Rescue & EMS (50.4%), Fire (14.8%), and Good Intent Call (12.8%).
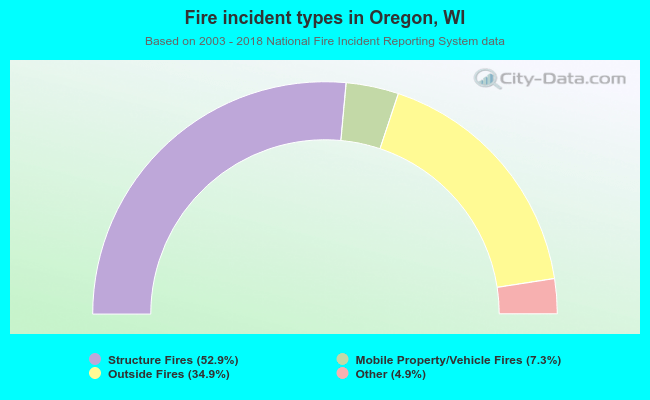 When looking into fire subcategories, the most reports belonged to: Structure Fires (52.9%), and Outside Fires (34.9%).