Monona: Fire Incidents, Wisconsin (WI)
Where are fire incidents reported in Monona, WI
Something went wrong! Please refresh the page.
|
| |||||||||||||||||||||||||||||||||||||||||||||||||||||||||||||||||||||||||||||||||||||||||||||||||||||||||||||
2003 - 2018 National Fire Incident Reporting System (NFIRS) incidents
- Incident types reported to NFIRS in Monona, WI
- 92938.3%Rescue & EMS
- 48119.8%False Alarm
- 33213.7%Fire
- 31713.1%Hazardous Condition
- 26010.7%Good Intent Call
- 923.8%Service Call
- 120.5%Overpressure Rupture
- 40.2%Special Incident
- Fire incident types reported to NFIRS in Monona, WI
- 17452.4%Structure Fires
- 7522.6%Outside Fires
- 6920.8%Mobile Property/Vehicle Fires
- 144.2%Other
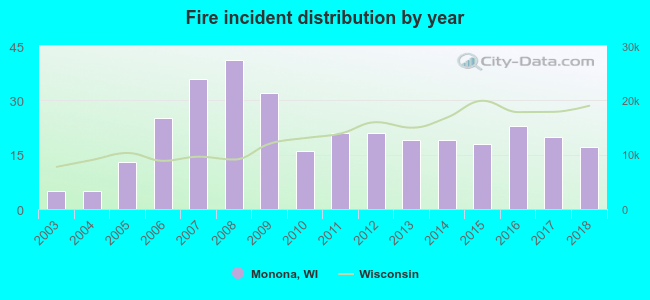 According to the data from the years 2003 - 2018 the average number of fire incidents per year is 21. The highest number of fire incidents - 41 took place in 2008, and the least - 5 in 2003. The data has a growing trend.
The average number of yearly fire incidents per 10k residents in Monona, WI compared to nearest cities:
(Note: Based on data for the last 3 years, including only cities with population 5,000 and above)
| Monona: | 25.4 |
| Madison: | 8.6 |
| McFarland: | 33.0 |
| Fitchburg: | 33.1 |
| Cottage Grove: | 45.0 |
| Middleton: | 24.1 |
| Oregon: | 24.0 |
| Sun Prairie: | 21.2 |
| Waunakee: | 17.1 |

 According to the data from the years 2003 - 2018 the average number of fire-related yearly casualties is 0. The highest number of reported injuries - 2 took place in 2009, and the lowest - 0 in 2003. The data has a constant trend.
 34.3% incidents where reported in the morning and 65.7% in the evening. The most fires (19.0%) took place on Tuesday, and the least (10.2%) on Friday.
 According to the 332 reports from years 2003 - 2018 most fires (12.7%) took place during July, and the least (6.0%) in November.
 Out of all 2,428 cases reported during the years 2003 - 2018, the most belonged to the categories: Rescue & EMS (38.3%), False Alarm (19.8%), and Fire (13.7%).
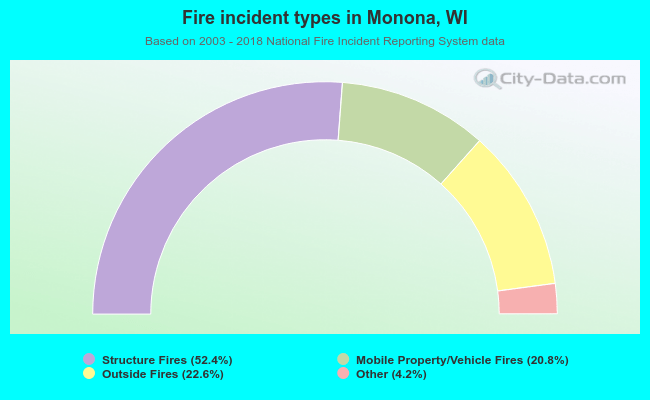 When looking into fire subcategories, the most reports belonged to: Structure Fires (52.4%), and Outside Fires (22.6%).