Orwell: Fire Incidents, Ohio (OH)
Where are fire incidents reported in Orwell, OH
Something went wrong! Please refresh the page.
|
| |||||||||||||||||||||||||||||||||||||||||||||||||||||||||||||||||||||||||||||||||||||||||||||||||||||||||||||
2003 - 2018 National Fire Incident Reporting System (NFIRS) incidents
- Incident types reported to NFIRS in Orwell, OH
- 49041.6%Fire
- 27923.7%Hazardous Condition
- 19316.4%Service Call
- 1089.2%Rescue & EMS
- 504.2%False Alarm
- 453.8%Good Intent Call
- 110.9%Severe Weather
- 30.3%Overpressure Rupture
- Fire incident types reported to NFIRS in Orwell, OH
- 26754.5%Structure Fires
- 17635.9%Outside Fires
- 479.6%Mobile Property/Vehicle Fires
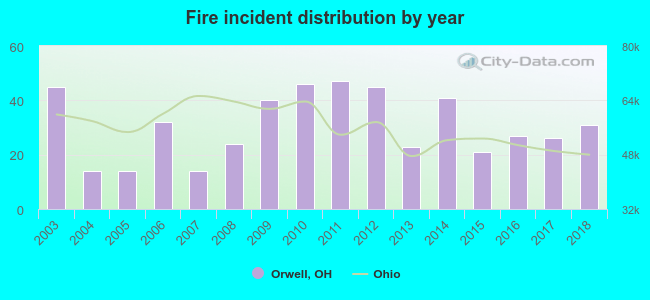 Based on the data from the years 2003 - 2018 the average number of fire incidents per year is 31. The highest number of reported fires - 47 took place in 2011, and the least - 14 in 2004. The data has a decreasing trend.
 24.3% incidents where reported in the morning and 75.7% in the evening. The most fires (15.3%) took place on Friday, and the least (13.5%) on Thursday.
 According to the 490 incident reports from years 2003 - 2018 most fires (14.1%) took place during April, and the least (4.7%) in September.
 Out of all 1,179 cases reported during the years 2003 - 2018, the most belonged to the categories: Fire (41.6%), Hazardous Condition (23.7%), and Service Call (16.4%).
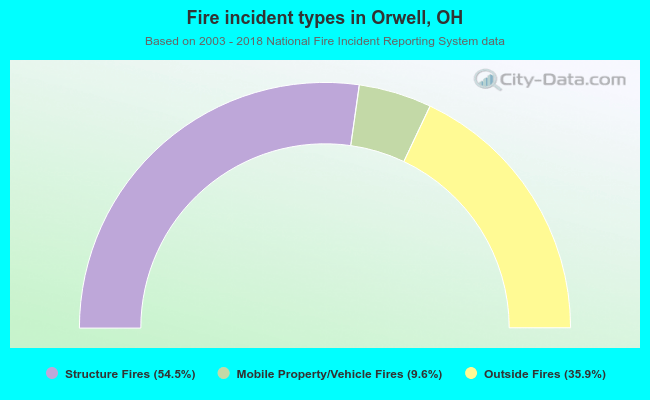 When looking into fire subcategories, the most reports belonged to: Structure Fires (54.5%), and Outside Fires (35.9%).