Owasso: Fire Incidents, Oklahoma (OK)
Where are fire incidents reported in Owasso, OK
Something went wrong! Please refresh the page.
| Fire incidents reported | |
|---|---|
| Sreet name | Count |
| US 169 | 98 |
| 86 ST | 70 |
| 96 ST | 58 |
| GARNETT RD | 58 |
| E 86 ST N | 54 |
| E 96 ST N | 54 |
| 116 ST | 52 |
| MEMORIAL | 52 |
| 106 ST | 46 |
| 121 AVE | 42 |
| N GARNETT RD | 42 |
| 76 ST | 40 |
| N OWASSO EXPY | 40 |
| 129 AVE | 38 |
| SHERIDAN | 38 |
| HIGHWAY 169 HWY | 36 |
| E 106 ST N | 34 |
| 169 HWY | 32 |
| OWASSO EXPRESSWAY | 32 |
| 117 AVE | 30 |
| 80 ST | 26 |
| 97 AVE | 24 |
| CEDAR | 24 |
| MINGO | 24 |
| N 129 E AVE | 24 |
| 145 AVE | 22 |
| 83 ST | 22 |
| ATLANTA | 22 |
| YALE | 22 |
| 100 ST | 20 |
| Other | 704 |
2002 - 2018 National Fire Incident Reporting System (NFIRS) incidents
- Incident types reported to NFIRS in Owasso, OK
- 13,30467.1%Rescue & EMS
- 1,8809.5%Fire
- 1,5487.8%False Alarm
- 1,0765.4%Service Call
- 1,0015.0%Hazardous Condition
- 9614.8%Good Intent Call
- 260.1%Overpressure Rupture
- 230.1%Special Incident
- 200.1%Severe Weather
- Fire incident types reported to NFIRS in Owasso, OK
- 93749.8%Outside Fires
- 52928.1%Structure Fires
- 32217.1%Mobile Property/Vehicle Fires
- 924.9%Other
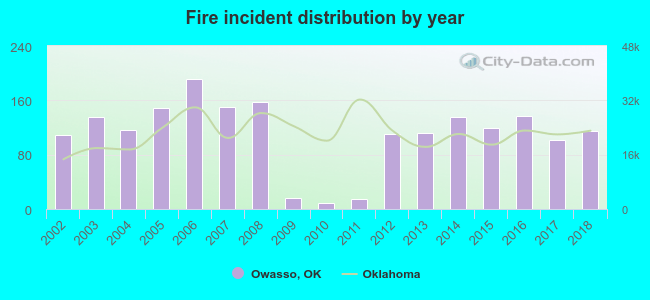 According to the data from the years 2002 - 2018 the average number of fires per year is 111. The highest number of fires - 191 took place in 2006, and the least - 9 in 2010. The data has a growing trend.
The average number of yearly fire incidents per 10k residents in Owasso, OK compared to nearest cities:
(Note: Based on data for the last 3 years, including only cities with population 5,000 and above)
| Owasso: | 34.9 |
| Collinsville: | 102.6 |
| Catoosa: | 95.6 |
| Claremore: | 109.6 |
| Tulsa: | 50.9 |
| Skiatook: | 126.3 |
| Broken Arrow: | 20.0 |
| Sand Springs: | 130.8 |
| Jenks: | 35.9 |
 The median response time based on all reported fire incidents is 5 minutes. This is lower compared to the state median value.
The median response time in Owasso, OK compared to nearest cities:
(Note: Based on data for all years, including only cities with at least 500 fire incidents)
| Owasso: | 5 minutes |
| Collinsville: | 7 minutes |
| Catoosa: | 7 minutes |
| Sperry: | 6 minutes |
| Claremore: | 6 minutes |
| Oologah: | 7 minutes |
| Tulsa: | 4 minutes |
| Skiatook: | 8 minutes |
| Broken Arrow: | 6 minutes |
 According to the data from the years 2002 - 2018 the average number of fire-related casualties per year is 0. The highest number of injuries - 2 took place in 2007, and the lowest - 0 in 2003. The data has a declining trend.
The average number of casualties per 1,000 fire incidents is 2. This indicator was the highest - 13 in 2007, and the lowest 0 in 2003. The trend for casualties per 1,000 fire incidents is dropping. Compared to the state value the number of casualties per 1,000 fires is lower.
According to the data from the years 2002 - 2018 the average number of fire-related casualties per year is 0. The highest number of injuries - 2 took place in 2007, and the lowest - 0 in 2003. The data has a declining trend.
The average number of casualties per 1,000 fire incidents is 2. This indicator was the highest - 13 in 2007, and the lowest 0 in 2003. The trend for casualties per 1,000 fire incidents is dropping. Compared to the state value the number of casualties per 1,000 fires is lower.Casualties per 1,000 incidents in Owasso, OK compared to nearest cities:
(Note: Based on data for all years, including only cities with at least 500 fire incidents)
| Owasso: | 2.1 |
| Collinsville: | 0.0 |
| Catoosa: | 1.7 |
| Sperry: | 1.3 |
| Claremore: | 3.7 |
| Oologah: | 4.3 |
| Tulsa: | 5.8 |
| Skiatook: | 0.0 |
| Broken Arrow: | 5.7 |
 26.5% incidents where reported in the morning and 73.5% in the evening. The most fires (15.2%) took place on Thursday, and the least (12.9%) on Tuesday.
 Based on the 1,880 reports from years 2002 - 2018 most fires (10.9%) took place during March, and the least (6.1%) in September.
 Out of all 19,839 cases reported during the years 2002 - 2018, the most belonged to the categories: Rescue & EMS (67.1%), Fire (9.5%), and False Alarm (7.8%).
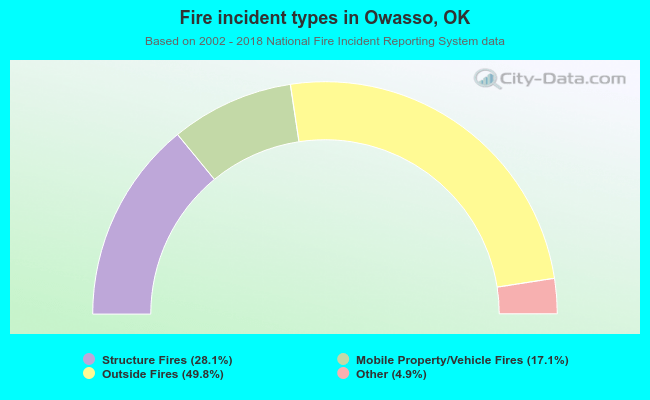 When looking into fire subcategories, the most incidents belonged to: Outside Fires (49.8%), and Structure Fires (28.1%).