Sand Springs: Fire Incidents, Oklahoma (OK)
Where are fire incidents reported in Sand Springs, OK
Something went wrong! Please refresh the page.
| Fire incidents reported | |
|---|---|
| Sreet name | Count |
| WEKIWA RD | 380 |
| HWY 64 EXPY | 172 |
| CHARLES PAGE BLVD | 156 |
| HWY 97 EXPY | 146 |
| HWY 51 | 136 |
| 241 W AVE | 118 |
| 64 HWY | 118 |
| HWY 51 EXPY | 118 |
| COYOTE TRAIL | 88 |
| 41 ST | 86 |
| SHELL CREEK RD | 82 |
| 265 W AVE | 76 |
| 97 HWY | 76 |
| ADAMS RD | 74 |
| MORROW RD | 74 |
| 209 W AVE | 70 |
| 41 ST | 68 |
| 71 ST | 62 |
| FRANKLIN AVE | 62 |
| 6 ST | 60 |
| CLEVELAND AVE | 58 |
| MAIN ST | 58 |
| MCKINLEY AVE | 58 |
| 16 ST | 54 |
| STATE HIGHWAY 64 | 54 |
| 17 ST | 50 |
| 51 HWY | 50 |
| VALLEY DR | 50 |
| COYOTE TRL | 46 |
| LINCOLN AVE | 46 |
| Other | 1,500 |
2002 - 2018 National Fire Incident Reporting System (NFIRS) incidents
- Incident types reported to NFIRS in Sand Springs, OK
- 13,26254.3%Rescue & EMS
- 4,24617.4%Fire
- 2,1078.6%Good Intent Call
- 2,0928.6%Service Call
- 1,5526.4%Hazardous Condition
- 1,0934.5%False Alarm
- Fire incident types reported to NFIRS in Sand Springs, OK
- 2,70563.7%Outside Fires
- 82619.5%Structure Fires
- 58613.8%Mobile Property/Vehicle Fires
- 1293.0%Other
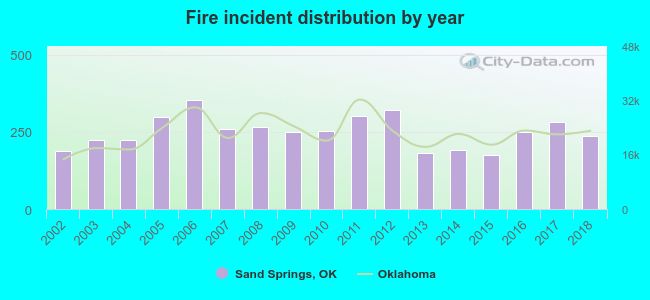 According to the data from the years 2002 - 2018 the average number of fires per year is 250. The highest number of reported fires - 352 took place in 2006, and the least - 175 in 2015. The data has a rising trend.
The average number of yearly fire incidents per 10k residents in Sand Springs, OK compared to nearest cities:
(Note: Based on data for the last 3 years, including only cities with population 5,000 and above)
| Sand Springs: | 130.8 |
| Sapulpa: | 90.7 |
| Tulsa: | 50.9 |
| Jenks: | 35.9 |
| Glenpool: | 49.5 |
| Skiatook: | 126.3 |
| Bixby: | 20.1 |
| Owasso: | 34.9 |
| Broken Arrow: | 20.0 |
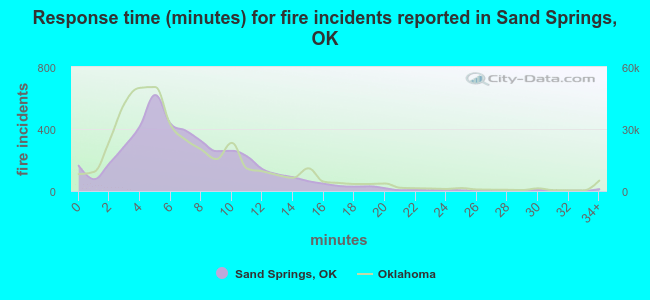 The median response time based on all reported fire incidents is 6 minutes. This is about the same as the Oklahoma median value.
The median response time in Sand Springs, OK compared to nearest cities:
(Note: Based on data for all years, including only cities with at least 500 fire incidents)
| Sand Springs: | 6 minutes |
| Sapulpa: | 5 minutes |
| Tulsa: | 4 minutes |
| Jenks: | 5 minutes |
| Sperry: | 6 minutes |
| Glenpool: | 4 minutes |
| Skiatook: | 8 minutes |
| Bixby: | 5 minutes |
| Owasso: | 5 minutes |
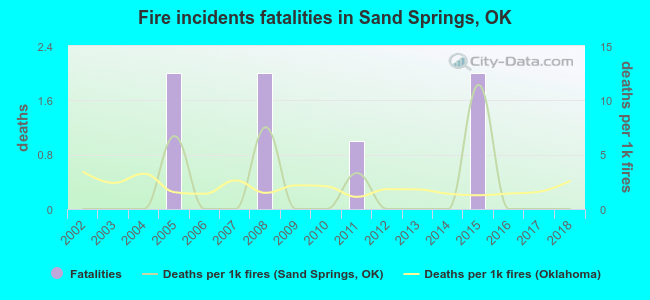 Based on the data from the years 2002 - 2018 the average number of fire-related yearly deaths is 0. The highest number of deaths - 2 took place in 2005, and the lowest - 0 in 2002. The data has a constant trend.
The average number of fatalities per 1,000 fire incidents is 2. This indicator was the highest - 11 in 2015, and the lowest 0 in 2002. The trend for fatalities per 1,000 incidents is constant. Compared to the Oklahoma value the number of fatalities per 1,000 incidents is similar.
Based on the data from the years 2002 - 2018 the average number of fire-related yearly deaths is 0. The highest number of deaths - 2 took place in 2005, and the lowest - 0 in 2002. The data has a constant trend.
The average number of fatalities per 1,000 fire incidents is 2. This indicator was the highest - 11 in 2015, and the lowest 0 in 2002. The trend for fatalities per 1,000 incidents is constant. Compared to the Oklahoma value the number of fatalities per 1,000 incidents is similar.Deaths per 1,000 incidents in Sand Springs, OK compared to nearest cities:
(Note: Based on data for all years, including only cities with at least 2,500 fire incidents)
| Sand Springs: | 1.6 |
| Sapulpa: | 1.1 |
| Tulsa: | 3.1 |
| Broken Arrow: | 1.4 |
| Claremore: | 0.9 |
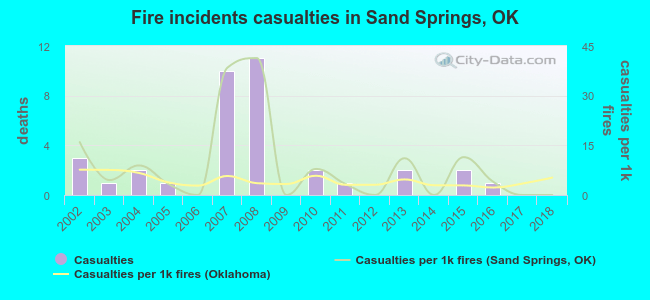 According to the reports from the years 2002 - 2018 the average number of fire-related casualties per year is 2. The highest number of reported casualties - 11 took place in 2008, and the lowest - 0 in 2006. The data has a declining trend.
The average number of injuries per 1,000 fires is 9. This indicator was the highest - 41 in 2008, and the lowest 0 in 2006. The trend for injuries per 1,000 fires is dropping. Compared to the state value the number of casualties per 1,000 incidents is much higher.
According to the reports from the years 2002 - 2018 the average number of fire-related casualties per year is 2. The highest number of reported casualties - 11 took place in 2008, and the lowest - 0 in 2006. The data has a declining trend.
The average number of injuries per 1,000 fires is 9. This indicator was the highest - 41 in 2008, and the lowest 0 in 2006. The trend for injuries per 1,000 fires is dropping. Compared to the state value the number of casualties per 1,000 incidents is much higher.
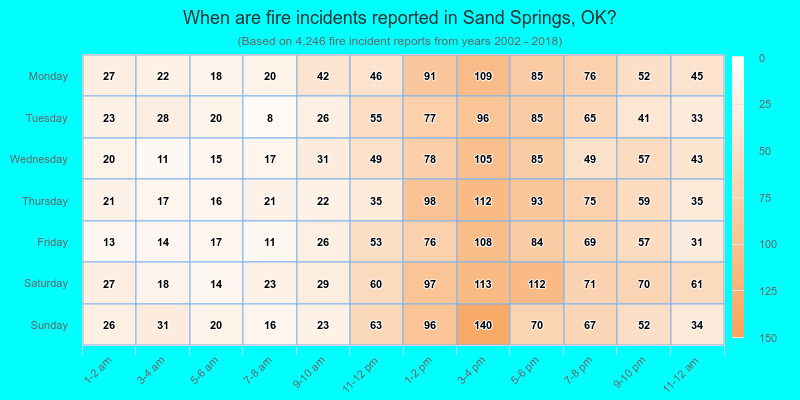
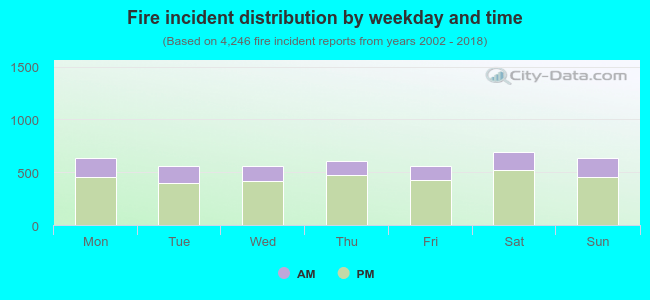 25.8% incidents where reported in the morning and 74.2% in the evening. The most fires (16.4%) took place on Saturday, and the least (13.1%) on Tuesday.
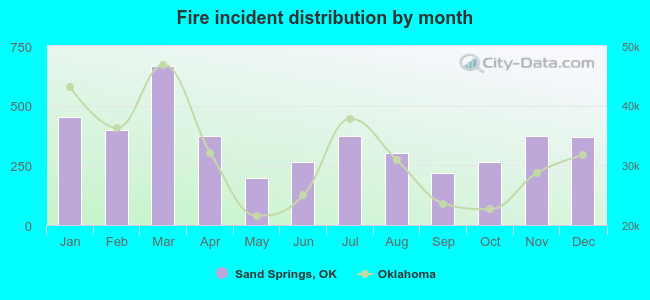 Based on the 4,246 fires from years 2002 - 2018 most fires (15.7%) took place during March, and the least (4.7%) in May.
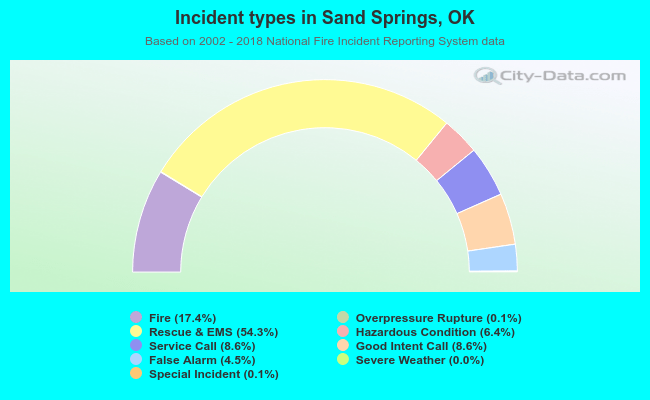 Out of all 24,408 cases reported during the years 2002 - 2018, the most belonged to the categories: Rescue & EMS (54.3%), Fire (17.4%), and Good Intent Call (8.6%).
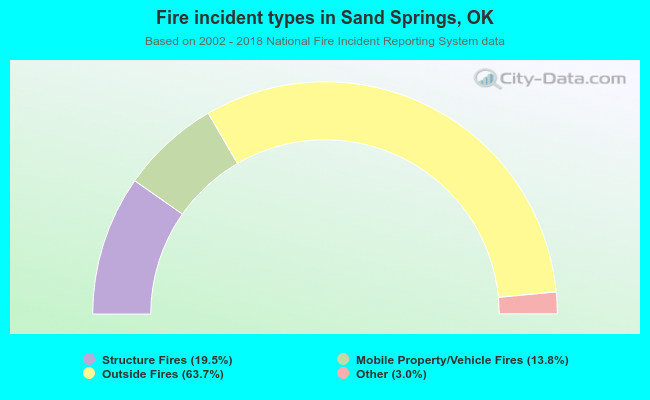 When looking into fire subcategories, the most reports belonged to: Outside Fires (63.7%), and Structure Fires (19.5%).