Oxford: Fire Incidents, Kansas (KS)
Where are fire incidents reported in Oxford, KS
Something went wrong! Please refresh the page.
|
| |||||||||||||||||||||||||||||||||||||||||||||||||||||||||||||||||||||||||||||||||||||||||||||||||||||||||||||
2002 - 2018 National Fire Incident Reporting System (NFIRS) incidents
- Incident types reported to NFIRS in Oxford, KS
- 20242.4%Fire
- 10722.5%Rescue & EMS
- 9720.4%Hazardous Condition
- 449.2%Good Intent Call
- 132.7%False Alarm
- 122.5%Service Call
- 10.2%Severe Weather
- Fire incident types reported to NFIRS in Oxford, KS
- 14270.3%Outside Fires
- 3215.8%Structure Fires
- 2110.4%Mobile Property/Vehicle Fires
- 73.5%Other
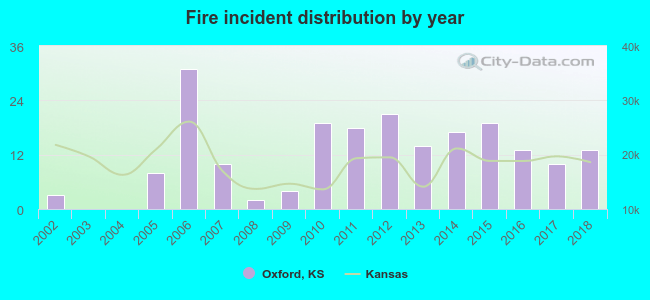 According to the data from the years 2002 - 2018 the average number of fire incidents per year is 12. The highest number of reported fire incidents - 31 took place in 2006, and the least - 0 in 2003. The data has a growing trend.
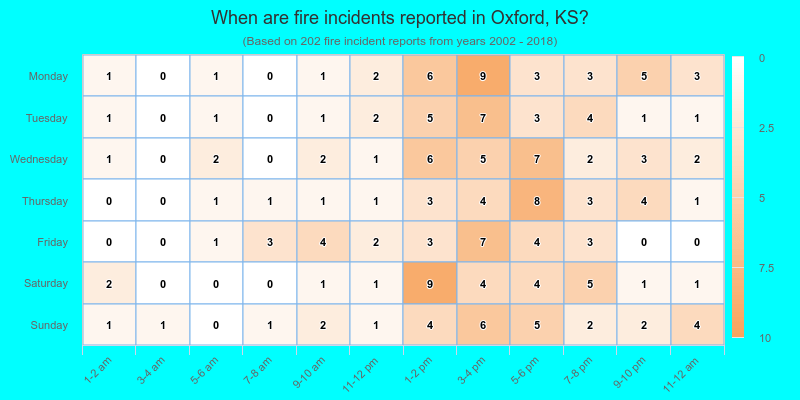
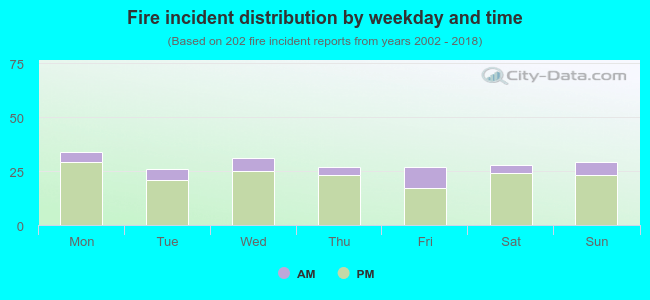 19.8% incidents where reported in the morning and 80.2% in the evening. The most fires (16.8%) took place on Monday, and the least (12.9%) on Tuesday.
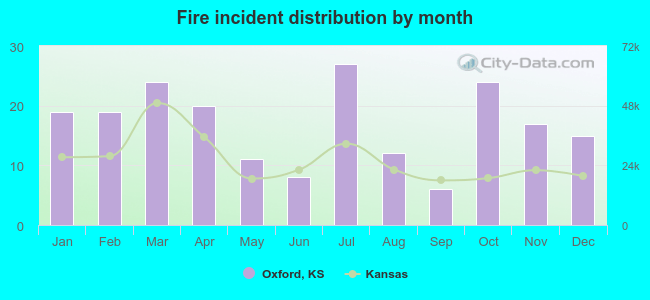 Based on the 202 reports from years 2002 - 2018 most fires (13.4%) took place during July, and the least (3.0%) in September.
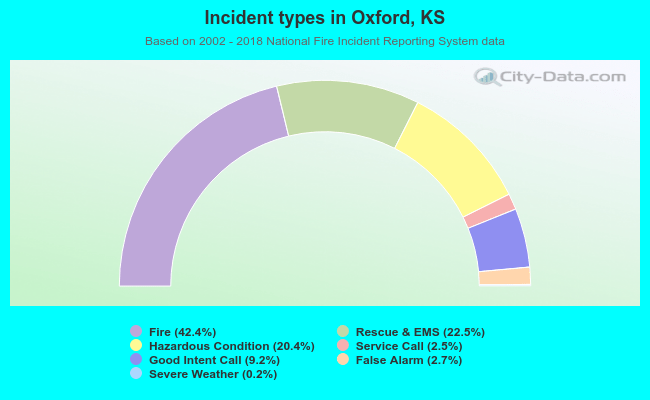 Out of all 476 cases reported during the years 2002 - 2018, the most belonged to the categories: Fire (42.4%), Overpressure Rupture (22.5%), and Rescue & EMS (20.4%).
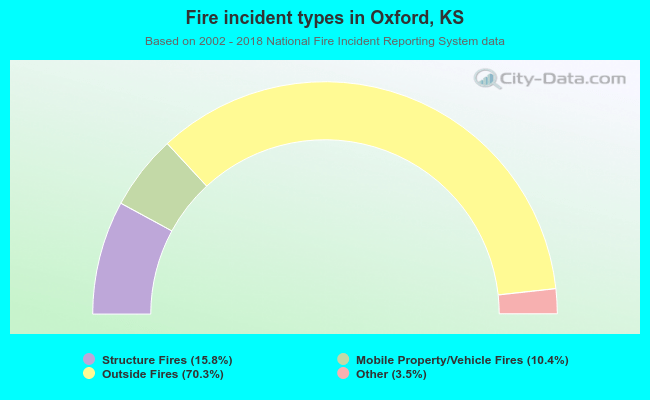 When looking into fire subcategories, the most reports belonged to: Outside Fires (70.3%), and Structure Fires (15.8%).