Paradise: Fire Incidents, Pennsylvania (PA)
Where are fire incidents reported in Paradise, PA
Something went wrong! Please refresh the page.
|
| |||||||||||||||||||||||||||||||||||||||||||||||||||||||||||||||||||||||||||||||||||||||||||||||||||||||||||||
2002 - 2018 National Fire Incident Reporting System (NFIRS) incidents
- Incident types reported to NFIRS in Paradise, PA
- 53653.1%Fire
- 21020.8%Hazardous Condition
- 12412.3%Rescue & EMS
- 777.6%Service Call
- 414.1%Good Intent Call
- 202.0%False Alarm
- Fire incident types reported to NFIRS in Paradise, PA
- 32660.8%Structure Fires
- 9818.3%Other
- 8916.6%Outside Fires
- 234.3%Mobile Property/Vehicle Fires
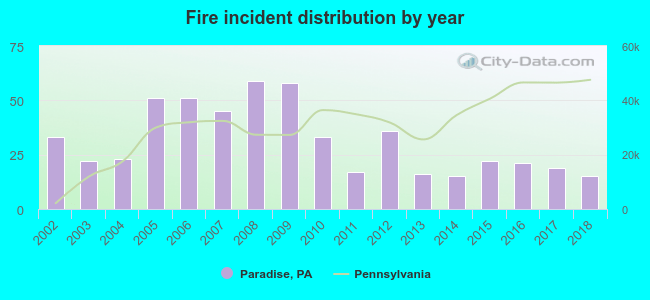 According to the data from the years 2002 - 2018 the average number of fire incidents per year is 32. The highest number of reported fire incidents - 59 took place in 2008, and the least - 15 in 2014. The data has a dropping trend.
 The median response time based on all reported fire incidents is 7 minutes. This is similar to the state median value.
The median response time in Paradise, PA compared to nearest cities:
(Note: Based on data for all years, including only cities with at least 500 fire incidents)
| Paradise: | 7 minutes |
| Strasburg: | 9 minutes |
| Gap: | 8 minutes |
| New Holland: | 7 minutes |
| Christiana: | 8 minutes |
| Quarryville: | 9 minutes |
| Lancaster: | 7 minutes |
| Parkesburg: | 9 minutes |
| Millersville: | 8 minutes |
 37.9% incidents where reported in the morning and 62.1% in the evening. The most fires (19.2%) took place on Saturday, and the least (9.5%) on Wednesday.
 According to the 536 fire incident reports from years 2002 - 2018 most fires (11.8%) took place during April, and the least (4.3%) in September.
 Out of all 1,010 cases reported during the years 2002 - 2018, the most belonged to the categories: Fire (53.1%), Hazardous Condition (20.8%), and Rescue & EMS (12.3%).
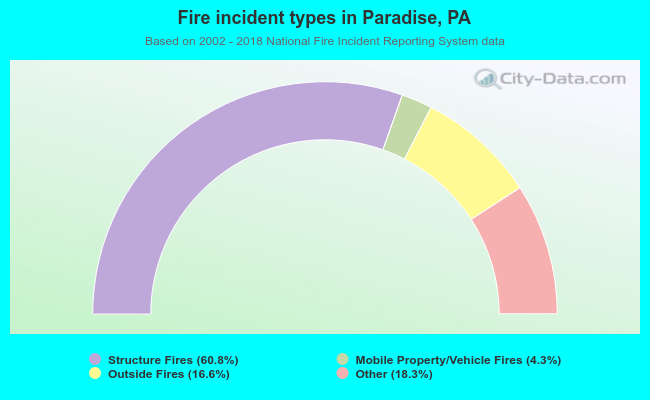 When looking into fire subcategories, the most reports belonged to: Structure Fires (60.8%), and Other (18.3%).