New Holland: Fire Incidents, Pennsylvania (PA)
Where are fire incidents reported in New Holland, PA
Something went wrong! Please refresh the page.
|
| |||||||||||||||||||||||||||||||||||||||||||||||||||||||||||||||||||||||||||||||||||||||||||||||||||||||||||||
2002 - 2018 National Fire Incident Reporting System (NFIRS) incidents
- Incident types reported to NFIRS in New Holland, PA
- 77633.9%Fire
- 54823.9%Hazardous Condition
- 29012.7%Rescue & EMS
- 26511.6%Good Intent Call
- 2139.3%False Alarm
- 1838.0%Service Call
- 90.4%Special Incident
- 70.3%Severe Weather
- Fire incident types reported to NFIRS in New Holland, PA
- 60177.4%Structure Fires
- 11514.8%Outside Fires
- 415.3%Mobile Property/Vehicle Fires
- 192.4%Other
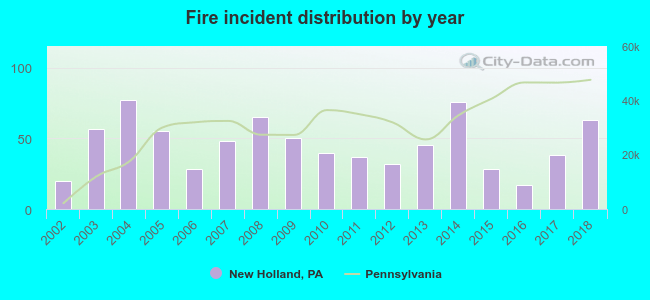 Based on the data from the years 2002 - 2018 the average number of fires per year is 46. The highest number of reported fires - 77 took place in 2004, and the least - 17 in 2016. The data has a rising trend.
The average number of yearly fire incidents per 10k residents in New Holland, PA compared to nearest cities:
(Note: Based on data for the last 3 years, including only cities with population 5,000 and above)
| New Holland: | 72.6 |
| Ephrata: | 53.0 |
| Lititz: | 50.4 |
| Lancaster: | 100.2 |
| Willow Street: | 31.7 |
| Shillington: | 50.7 |
| Millersville: | 27.5 |
| Coatesville: | 118.0 |
| Wyomissing: | 48.1 |
 The median response time based on all reported fire incidents is 7 minutes. This is similar to the Pennsylvania median value.
The median response time in New Holland, PA compared to nearest cities:
(Note: Based on data for all years, including only cities with at least 500 fire incidents)
| New Holland: | 7 minutes |
| Paradise: | 7 minutes |
| Ephrata: | 8 minutes |
| Gap: | 8 minutes |
| Honey Brook: | 8 minutes |
| Denver: | 9 minutes |
| Strasburg: | 9 minutes |
| Christiana: | 8 minutes |
| Lititz: | 9 minutes |
 34.8% incidents where reported in the morning and 65.2% in the evening. The most fires (17.8%) took place on Wednesday, and the least (10.6%) on Sunday.
 According to the 776 reports from years 2002 - 2018 most fires (13.1%) took place during February, and the least (4.5%) in September.
 Out of all 2,292 cases reported during the years 2002 - 2018, the most belonged to the categories: Fire (33.9%), Hazardous Condition (23.9%), and Rescue & EMS (12.7%).
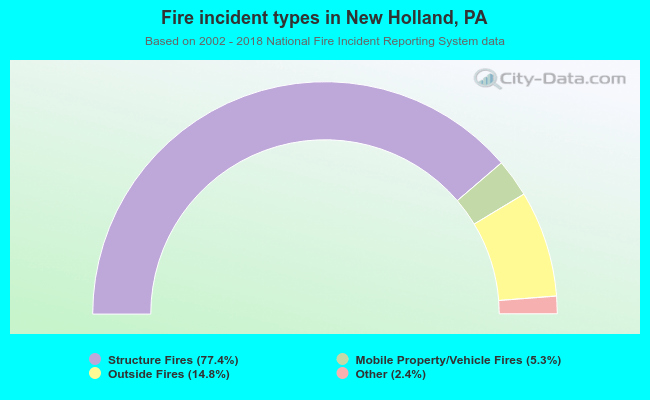 When looking into fire subcategories, the most reports belonged to: Structure Fires (77.4%), and Outside Fires (14.8%).