Paulsboro: Fire Incidents, New Jersey (NJ)
Where are fire incidents reported in Paulsboro, NJ
Something went wrong! Please refresh the page.
| Fire incidents reported | |
|---|---|
| Sreet name | Count |
| BROAD ST | 190 |
| DELAWARE ST | 114 |
| BILLINGS AVE | 48 |
| WASHINGTON ST | 42 |
| GREENWICH AVE | 38 |
| BILLINGSPORT RD | 36 |
| JEFFERSON ST | 34 |
| MANTUA AVE | 32 |
| ADAMS ST | 30 |
| BUCK ST | 30 |
| BAIRD AVE | 26 |
| COMMERCE ST | 26 |
| LINCOLN AVE | 26 |
| NASSAU AVE | 26 |
| MONROE ST | 24 |
| THOMSON AVE | 24 |
| MORTON AVE | 20 |
| SWEDESBORO AVE | 20 |
| BEACON AVE | 18 |
| ELIZABETH AVE | 18 |
| SPRUCE ST | 18 |
| CAPITOL ST | 16 |
| THOMPSON AVE | 16 |
| BERKLEY RD | 14 |
| COOK AVE | 14 |
| MADISON ST | 14 |
| BORRELLI BLVD | 12 |
| NEW ST | 12 |
| PENNLINE RD | 12 |
| SUMMIT AVE | 12 |
2003 - 2018 National Fire Incident Reporting System (NFIRS) incidents
- Incident types reported to NFIRS in Paulsboro, NJ
- 67746.5%Fire
- 34924.0%Hazardous Condition
- 1369.3%False Alarm
- 1067.3%Good Intent Call
- 976.7%Rescue & EMS
- 886.0%Service Call
- 20.1%Special Incident
- Fire incident types reported to NFIRS in Paulsboro, NJ
- 52677.7%Structure Fires
- 8712.9%Outside Fires
- 385.6%Other
- 263.8%Mobile Property/Vehicle Fires
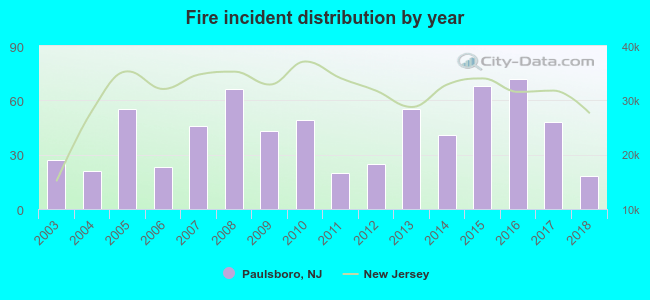 According to the data from the years 2003 - 2018 the average number of fires per year is 42. The highest number of fires - 72 took place in 2016, and the least - 18 in 2018. The data has a dropping trend.
The average number of yearly fire incidents per 10k residents in Paulsboro, NJ compared to nearest cities:
(Note: Based on data for the last 3 years, including only cities with population 5,000 and above)
| Paulsboro: | 76.8 |
| Woodbury: | 68.6 |
| Gloucester City: | 52.7 |
| Bellmawr: | 51.2 |
| Runnemede: | 46.2 |
| Pitman: | 48.3 |
| Haddon Heights: | 29.4 |
| Audubon: | 35.6 |
| Camden: | 55.5 |
 The median response time based on all reported fire incidents is 8 minutes. This is higher compared to the state median value.
The median response time in Paulsboro, NJ compared to nearest cities:
(Note: Based on data for all years, including only cities with at least 500 fire incidents)
| Paulsboro: | 8 minutes |
| Woodbury: | 7 minutes |
| Westville: | 6 minutes |
| Mullica Hill: | 9 minutes |
| Gloucester City: | 4 minutes |
| Bellmawr: | 6 minutes |
| Runnemede: | 7 minutes |
| Haddon Heights: | 6 minutes |
| Audubon: | 5 minutes |
 30.6% incidents where reported in the morning and 69.4% in the evening. The most fires (17.7%) took place on Friday, and the least (10.9%) on Sunday.
 According to the 677 reports from years 2003 - 2018 most fires (11.1%) took place during January, and the least (6.2%) in June.
 Out of all 1,456 cases reported during the years 2003 - 2018, the most belonged to the categories: Fire (46.5%), Hazardous Condition (24.0%), and False Alarm (9.3%).
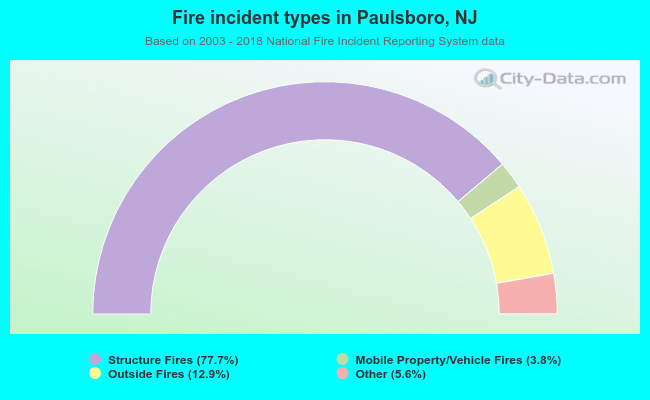 When looking into fire subcategories, the most reports belonged to: Structure Fires (77.7%), and Outside Fires (12.9%).