Pelham: Fire Incidents, New York (NY)
Where are fire incidents reported in Pelham, NY
Something went wrong! Please refresh the page.
|
| |||||||||||||||||||||||||||||||||||||||||||||||||||||||||||||||||||||||||||||||||||||||||||||||||||||||||||||
2002 - 2018 National Fire Incident Reporting System (NFIRS) incidents
- Incident types reported to NFIRS in Pelham, NY
- 1,68847.7%Rescue & EMS
- 60317.0%Hazardous Condition
- 45612.9%False Alarm
- 3038.6%Service Call
- 2747.7%Fire
- 1965.5%Good Intent Call
- 90.3%Severe Weather
- 50.1%Special Incident
- 40.1%Overpressure Rupture
- Fire incident types reported to NFIRS in Pelham, NY
- 19872.3%Structure Fires
- 3813.9%Outside Fires
- 2810.2%Mobile Property/Vehicle Fires
- 103.6%Other
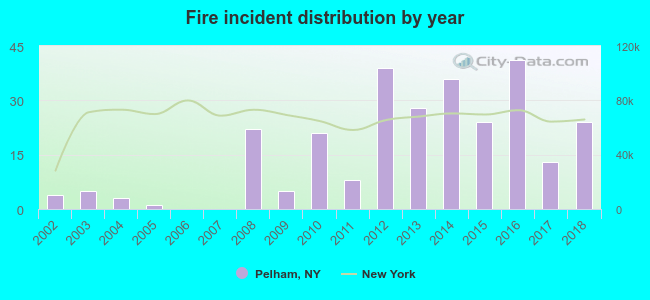 According to the data from the years 2002 - 2018 the average number of fires per year is 16. The highest number of reported fires - 41 took place in 2016, and the least - 0 in 2006. The data has a growing trend.
The average number of yearly fire incidents per 10k residents in Pelham, NY compared to nearest cities:
(Note: Based on data for the last 3 years, including only cities with population 5,000 and above)
| Pelham: | 37.0 |
| Pelham Manor: | 26.9 |
| Mount Vernon: | 37.5 |
| New Rochelle: | 75.2 |
| Bronxville: | 42.1 |
| Larchmont: | 22.9 |
| Tuckahoe: | 45.8 |
| Eastchester: | 27.6 |
| Yonkers: | 65.3 |
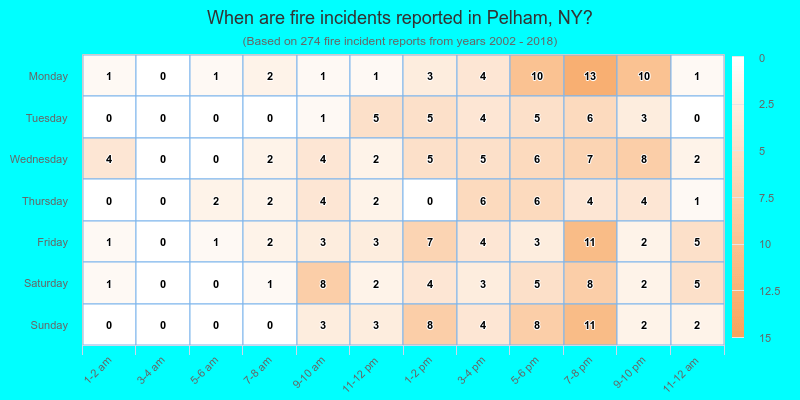
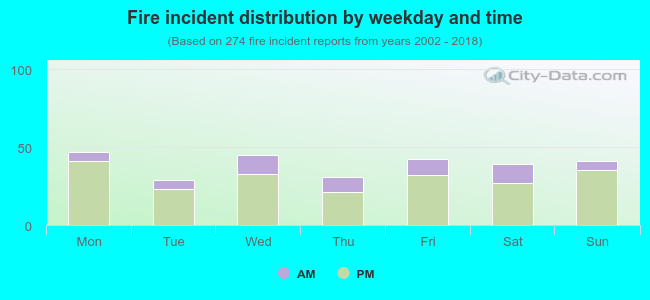 22.6% incidents where reported in the morning and 77.4% in the evening. The most fires (17.2%) took place on Monday, and the least (10.6%) on Tuesday.
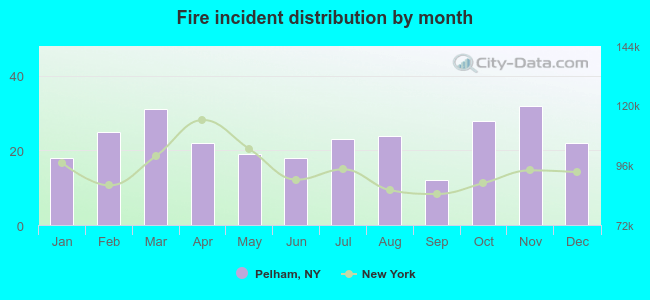 According to the 274 incident reports from years 2002 - 2018 most fires (11.7%) took place during November, and the least (4.4%) in September.
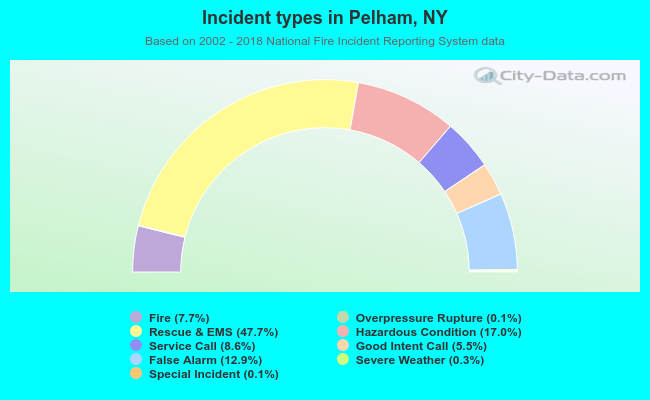 Out of all 3,538 cases reported during the years 2002 - 2018, the most belonged to the categories: Rescue & EMS (47.7%), Hazardous Condition (17.0%), and False Alarm (12.9%).
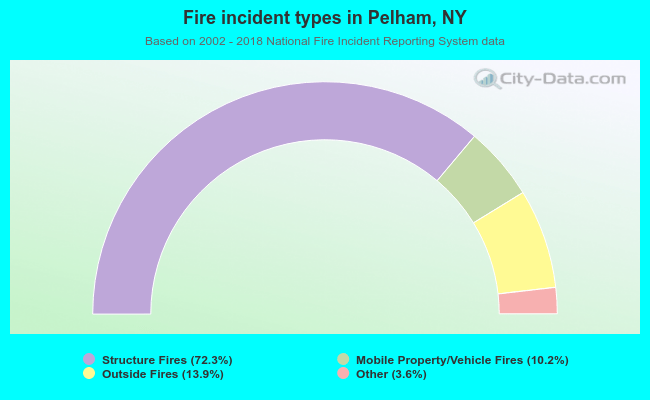 When looking into fire subcategories, the most incidents belonged to: Structure Fires (72.3%), and Outside Fires (13.9%).