Eastchester: Fire Incidents, New York (NY)
Where are fire incidents reported in Eastchester, NY
Something went wrong! Please refresh the page.
| Fire incidents reported | |
|---|---|
| Sreet name | Count |
| WHITE PLAINS RD | 188 |
| GARTH RD | 118 |
| MAIN ST | 34 |
| CALIFORNIA RD | 30 |
| MILL RD | 26 |
| CLAUDET WAY | 18 |
| HIGHLAND AVE | 18 |
| MANCHESTER RD | 18 |
| JACKSON AVE | 16 |
| PARK DR | 16 |
| SIWANOY BLVD | 16 |
| MONTGOMERY AVE | 14 |
| ARCHER DR | 12 |
| BROOK ST | 12 |
| GLEN RD | 12 |
| LAKEVIEW AVE | 12 |
| STEWART PL | 12 |
| WILMOT RD | 12 |
| BEECH ST | 10 |
| FISHER AVE | 10 |
| HALL AVE | 10 |
| JOHNSON RD | 10 |
| MAPLE AVE | 10 |
| NEW ST | 10 |
| NORTH RD | 10 |
| OAKRIDGE PL | 10 |
| RIDGE ST | 10 |
| STEBBINS AVE | 10 |
| VERNON DR | 10 |
| BRADLEY RD | 8 |
2003 - 2018 National Fire Incident Reporting System (NFIRS) incidents
- Incident types reported to NFIRS in Eastchester, NY
- 4,66045.3%Rescue & EMS
- 2,02119.6%Hazardous Condition
- 1,50414.6%False Alarm
- 9299.0%Service Call
- 6876.7%Fire
- 4854.7%Good Intent Call
- Fire incident types reported to NFIRS in Eastchester, NY
- 42962.4%Structure Fires
- 10615.4%Outside Fires
- 8312.1%Other
- 6910.0%Mobile Property/Vehicle Fires
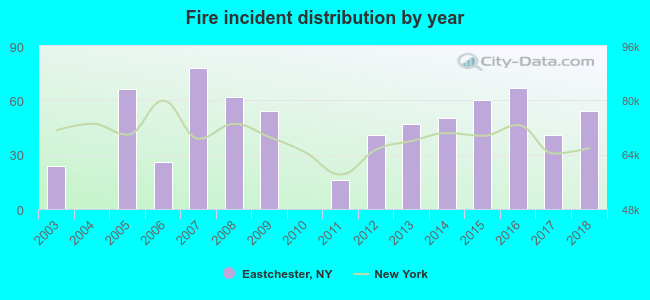 According to the data from the years 2003 - 2018 the average number of fires per year is 43. The highest number of fires - 78 took place in 2007, and the least - 0 in 2004. The data has an increasing trend.
The average number of yearly fire incidents per 10k residents in Eastchester, NY compared to nearest cities:
(Note: Based on data for the last 3 years, including only cities with population 5,000 and above)
| Eastchester: | 27.6 |
| Tuckahoe: | 45.8 |
| Bronxville: | 42.1 |
| New Rochelle: | 75.2 |
| Scarsdale: | 26.9 |
| Yonkers: | 65.3 |
| Mount Vernon: | 37.5 |
| Pelham: | 37.0 |
| Larchmont: | 22.9 |
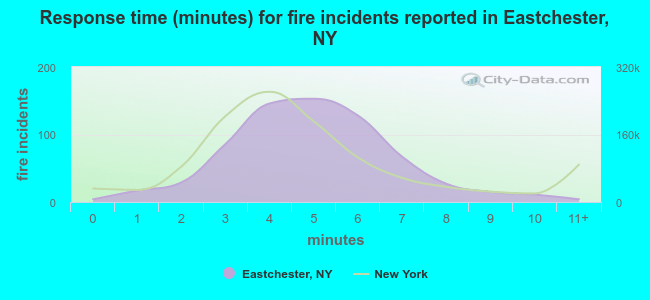 The median response time based on all reported fire incidents is 5 minutes. This is higher than the New York median value.
The median response time in Eastchester, NY compared to nearest cities:
(Note: Based on data for all years, including only cities with at least 500 fire incidents)
| Eastchester: | 5 minutes |
| New Rochelle: | 6 minutes |
| Scarsdale: | 4 minutes |
| Yonkers: | 5 minutes |
| Mount Vernon: | 4 minutes |
| Larchmont: | 2 minutes |
| Hartsdale: | 4 minutes |
| Dobbs Ferry: | 3 minutes |
| White Plains: | 4 minutes |
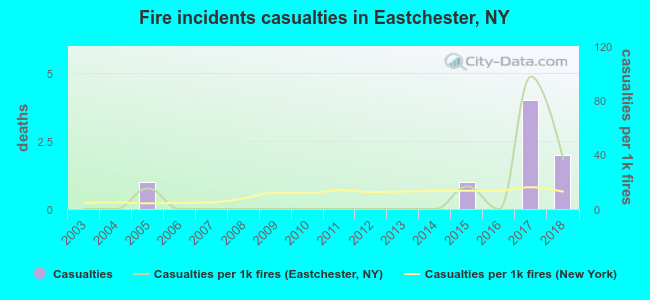 According to the data from the years 2003 - 2018 the average number of fire-related casualties per year is 1. The highest number of injuries - 4 took place in 2017, and the lowest - 0 in 2003. The data has a rising trend.
The average number of casualties per 1,000 fires is 10. This indicator was the highest - 98 in 2017, and the lowest 0 in 2003. The trend for casualties per 1,000 fire incidents is increasing. Compared to the state value the number of injuries per 1,000 incidents is similar.
According to the data from the years 2003 - 2018 the average number of fire-related casualties per year is 1. The highest number of injuries - 4 took place in 2017, and the lowest - 0 in 2003. The data has a rising trend.
The average number of casualties per 1,000 fires is 10. This indicator was the highest - 98 in 2017, and the lowest 0 in 2003. The trend for casualties per 1,000 fire incidents is increasing. Compared to the state value the number of injuries per 1,000 incidents is similar.Casualties per 1,000 incidents in Eastchester, NY compared to nearest cities:
(Note: Based on data for all years, including only cities with at least 500 fire incidents)
| Eastchester: | 11.6 |
| New Rochelle: | 2.0 |
| Scarsdale: | 5.5 |
| Yonkers: | 6.4 |
| Mount Vernon: | 9.7 |
| Larchmont: | 8.9 |
| Hartsdale: | 15.9 |
| Dobbs Ferry: | 1.9 |
| White Plains: | 7.2 |
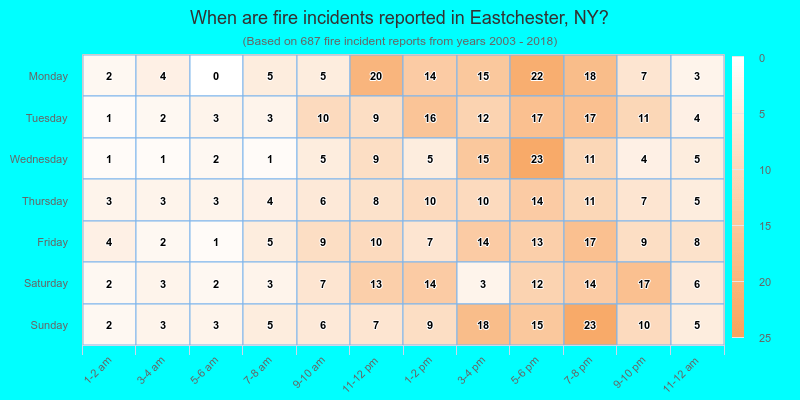
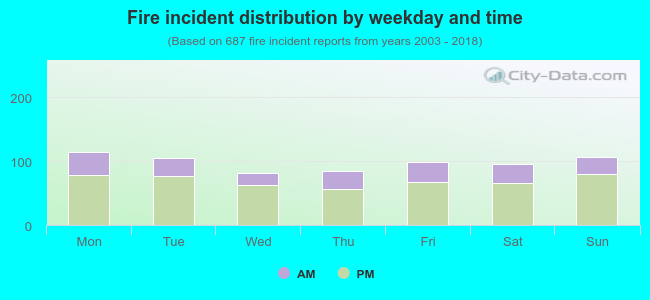 28.7% incidents where reported in the morning and 71.3% in the evening. The most fires (16.7%) took place on Monday, and the least (11.9%) on Wednesday.
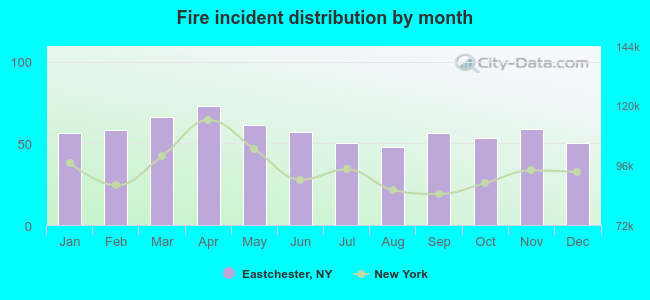 Based on the 687 incident reports from years 2003 - 2018 most fires (10.6%) took place during April, and the least (7.0%) in August.
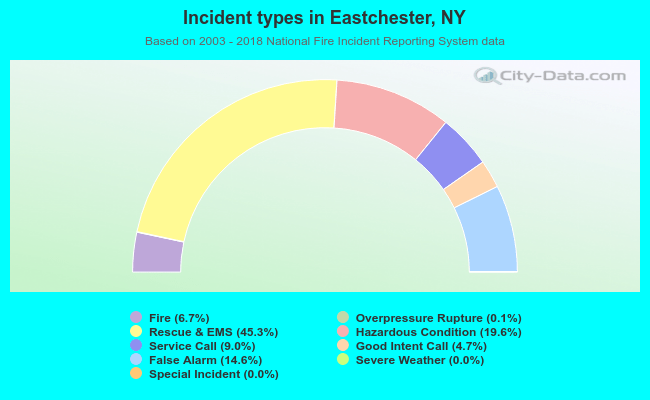 Out of all 10,298 cases reported during the years 2003 - 2018, the most belonged to the categories: Rescue & EMS (45.3%), Hazardous Condition (19.6%), and False Alarm (14.6%).
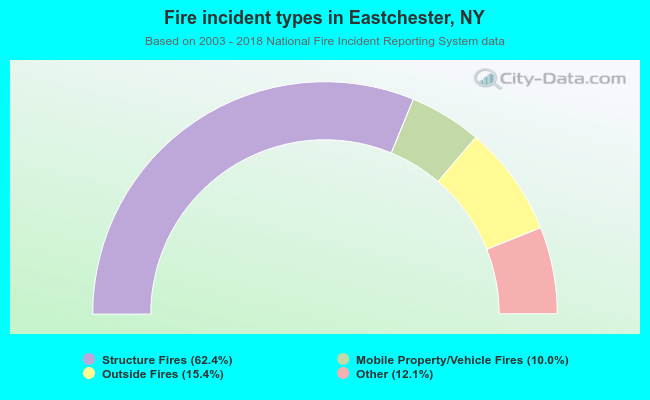 When looking into fire subcategories, the most incidents belonged to: Structure Fires (62.4%), and Outside Fires (15.4%).