Pinecrest: Fire Incidents, Florida (FL)
Where are fire incidents reported in Pinecrest, FL
Something went wrong! Please refresh the page.
|
| |||||||||||||||||||||||||||||||||||||||||||||||||||||||||||||||||||||||||||||||||||||||||||||||||||||||||||||
2008 - 2018 National Fire Incident Reporting System (NFIRS) incidents
- Incident types reported to NFIRS in Pinecrest, FL
- 4,49570.3%Rescue & EMS
- 4797.5%False Alarm
- 4537.1%Good Intent Call
- 4056.3%Hazardous Condition
- 3225.0%Service Call
- 2373.7%Fire
- Fire incident types reported to NFIRS in Pinecrest, FL
- 12753.6%Outside Fires
- 7130.0%Structure Fires
- 3414.3%Mobile Property/Vehicle Fires
- 52.1%Other
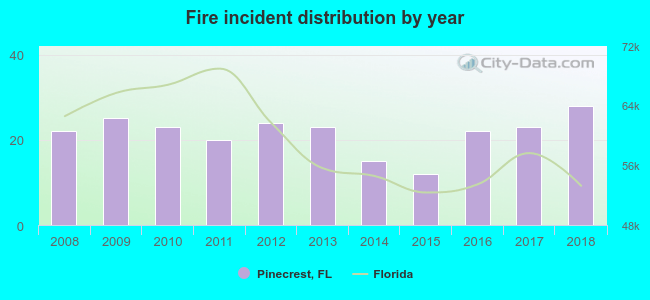 Based on the data from the years 2008 - 2018 the average number of fires per year is 22. The highest number of reported fire incidents - 28 took place in 2018, and the least - 12 in 2015. The data has a rising trend.
The average number of yearly fire incidents per 10k residents in Pinecrest, FL compared to nearest cities:
(Note: Based on data for the last 3 years, including only cities with population 5,000 and above)
| Pinecrest: | 12.6 |
| Palmetto Bay: | 9.5 |
| South Miami: | 15.9 |
| Coral Gables: | 13.7 |
| Cutler Bay: | 13.9 |
| West Miami: | 11.6 |
| University Park: | 4.8 |
| Sweetwater: | 7.6 |
| Key Biscayne: | 49.0 |
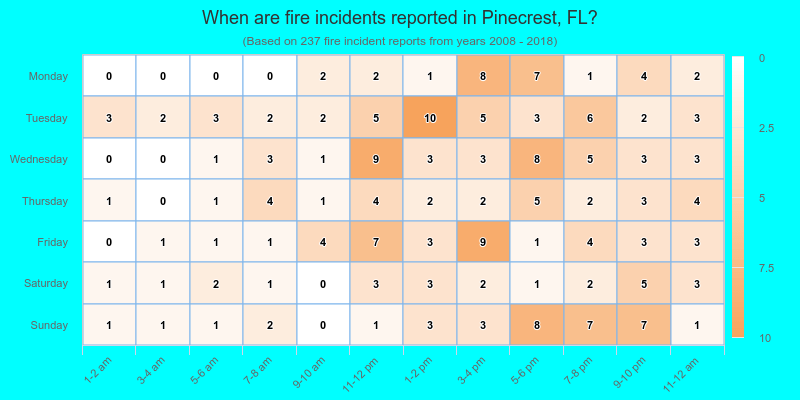
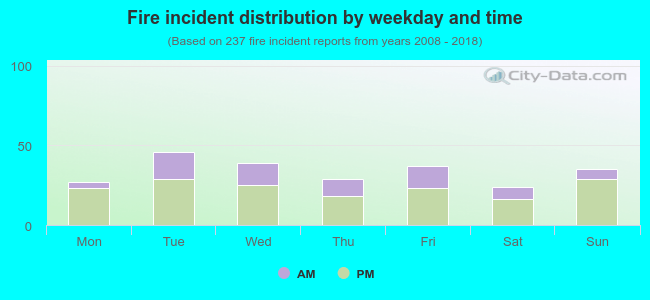 31.2% incidents where reported in the morning and 68.8% in the evening. The most fires (19.4%) took place on Tuesday, and the least (10.1%) on Saturday.
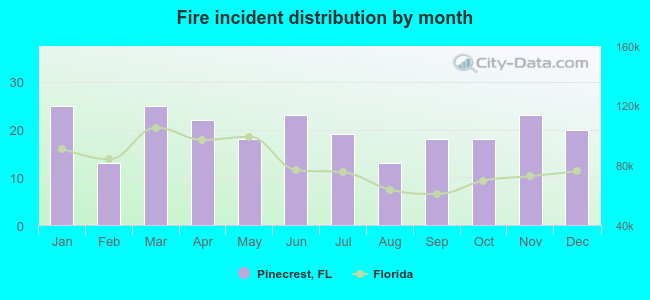 According to the 237 incident reports from years 2008 - 2018 most fires (10.5%) took place during January, and the least (5.5%) in February.
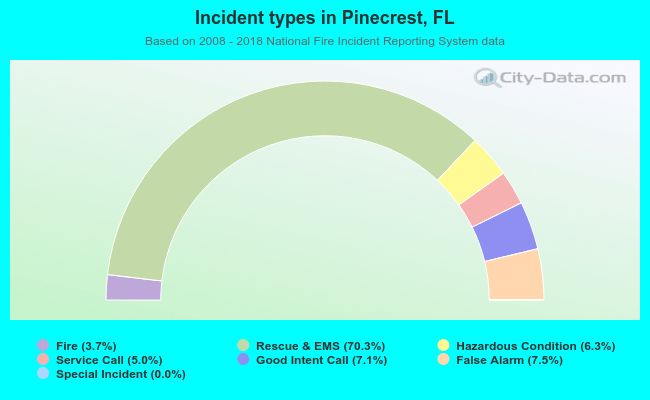 Out of all 6,392 cases reported during the years 2008 - 2018, the most belonged to the categories: Overpressure Rupture (70.3%), Good Intent Call (7.5%), and Service Call (7.1%).
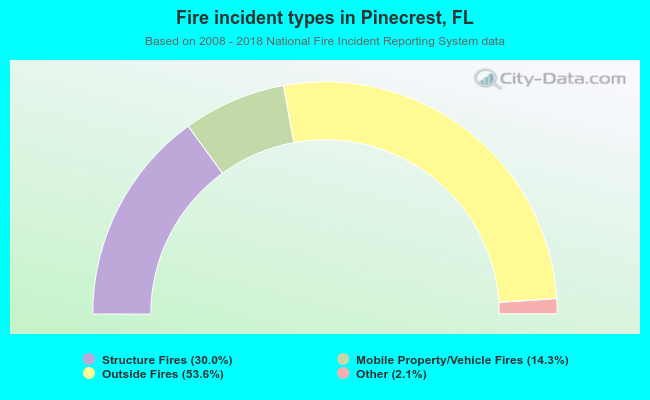 When looking into fire subcategories, the most reports belonged to: Outside Fires (53.6%), and Structure Fires (30.0%).