South Miami: Fire Incidents, Florida (FL)
Where are fire incidents reported in South Miami, FL
Something went wrong! Please refresh the page.
|
| |||||||||||||||||||||||||||||||||||||||||||||||||||||||||||||||||||||||||||||||||||||||||||||||||||||||||||||
2008 - 2018 National Fire Incident Reporting System (NFIRS) incidents
- Incident types reported to NFIRS in South Miami, FL
- 5,80171.2%Rescue & EMS
- 82910.2%False Alarm
- 5006.1%Good Intent Call
- 3844.7%Service Call
- 3464.2%Hazardous Condition
- 2883.5%Fire
- Fire incident types reported to NFIRS in South Miami, FL
- 14751.0%Outside Fires
- 9533.0%Structure Fires
- 4415.3%Mobile Property/Vehicle Fires
- 20.7%Other
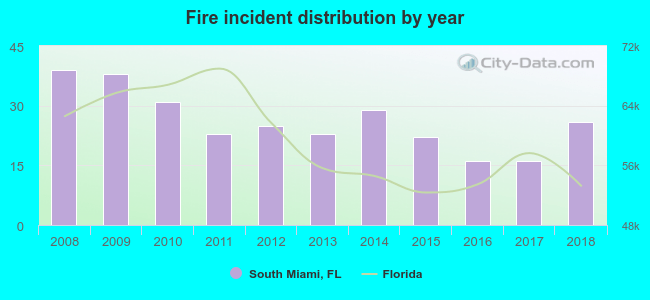 Based on the data from the years 2008 - 2018 the average number of fires per year is 26. The highest number of fire incidents - 39 took place in 2008, and the least - 16 in 2016. The data has a declining trend.
The average number of yearly fire incidents per 10k residents in South Miami, FL compared to nearest cities:
(Note: Based on data for the last 3 years, including only cities with population 5,000 and above)
| South Miami: | 15.9 |
| Coral Gables: | 13.7 |
| West Miami: | 11.6 |
| Pinecrest: | 12.6 |
| University Park: | 4.8 |
| Sweetwater: | 7.6 |
| Palmetto Bay: | 9.5 |
| Miami: | 21.7 |
| Miami Springs: | 12.0 |
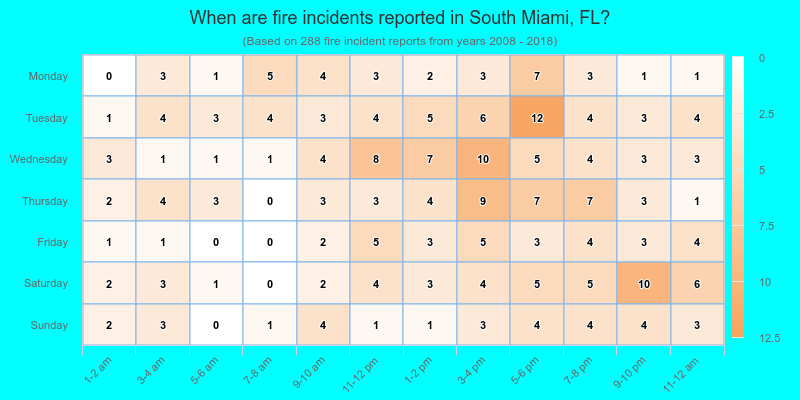
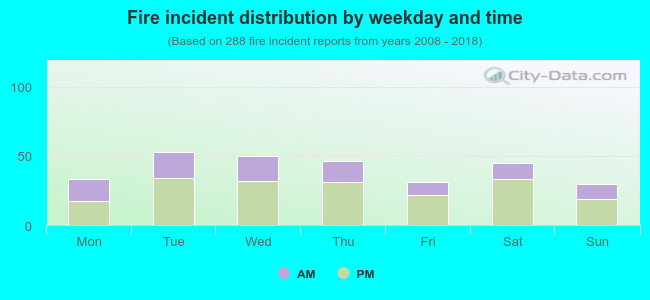 34.7% incidents where reported in the morning and 65.3% in the evening. The most fires (18.4%) took place on Tuesday, and the least (10.4%) on Sunday.
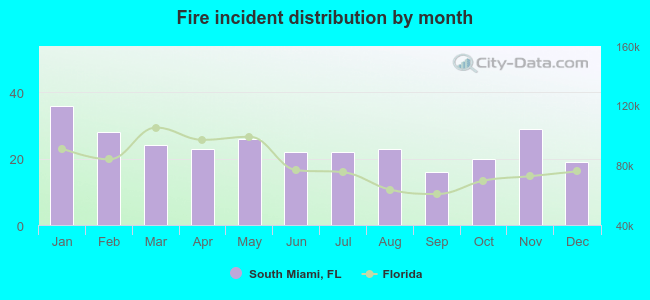 Based on the 288 fire incident reports from years 2008 - 2018 most fires (12.5%) took place during January, and the least (5.6%) in September.
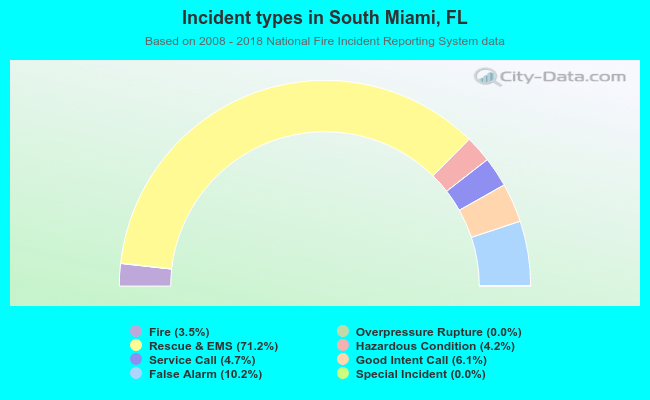 Out of all 8,151 cases reported during the years 2008 - 2018, the most belonged to the categories: Rescue & EMS (71.2%), False Alarm (10.2%), and Good Intent Call (6.1%).
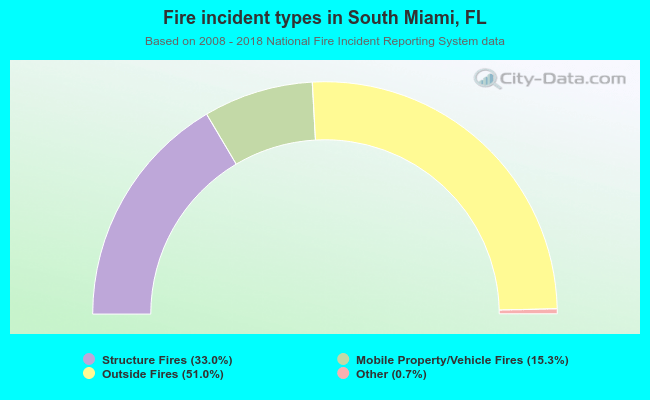 When looking into fire subcategories, the most incidents belonged to: Outside Fires (51.0%), and Structure Fires (33.0%).