Port Chester: Fire Incidents, New York (NY)
Where are fire incidents reported in Port Chester, NY
Something went wrong! Please refresh the page.
|
| |||||||||||||||||||||||||||||||||||||||||||||||||||||||||||||||||||||||||||||||||||||||||||||||||||||||||||||
2002 - 2018 National Fire Incident Reporting System (NFIRS) incidents
- Incident types reported to NFIRS in Port Chester, NY
- 64030.4%False Alarm
- 63530.2%Hazardous Condition
- 43120.5%Fire
- 22010.4%Service Call
- 914.3%Good Intent Call
- 833.9%Rescue & EMS
- 50.2%Overpressure Rupture
- Fire incident types reported to NFIRS in Port Chester, NY
- 26060.3%Structure Fires
- 12428.8%Outside Fires
- 378.6%Mobile Property/Vehicle Fires
- 102.3%Other
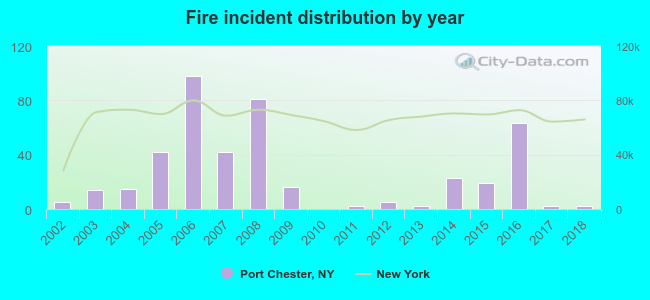 Based on the data from the years 2002 - 2018 the average number of fires per year is 25. The highest number of fire incidents - 98 took place in 2006, and the least - 0 in 2010. The data has a dropping trend.
The average number of yearly fire incidents per 10k residents in Port Chester, NY compared to nearest cities:
(Note: Based on data for the last 3 years, including only cities with population 5,000 and above)
| Port Chester: | 7.6 |
| Rye Brook: | 19.9 |
| Harrison: | 10.5 |
| Rye: | 23.8 |
| White Plains: | 29.4 |
| Scarsdale: | 26.9 |
| Larchmont: | 22.9 |
| Hartsdale: | 102.7 |
| North Castle: | 5.9 |
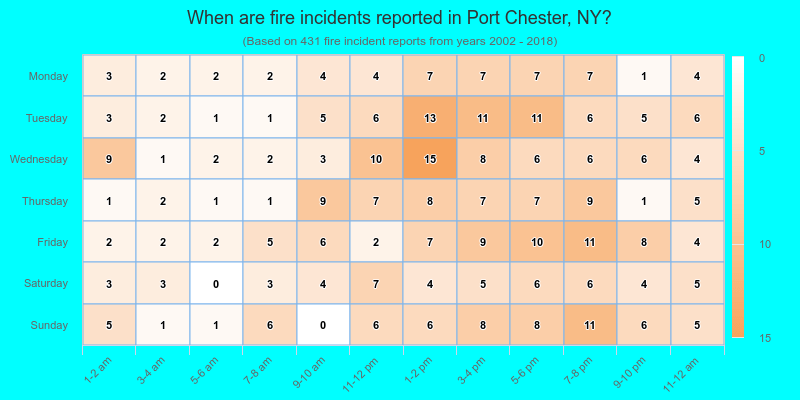
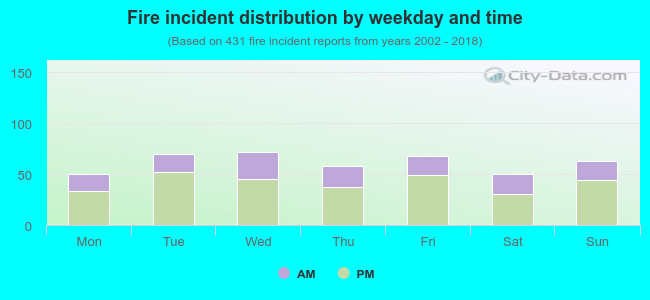 32.7% incidents where reported in the morning and 67.3% in the evening. The most fires (16.7%) took place on Wednesday, and the least (11.6%) on Monday.
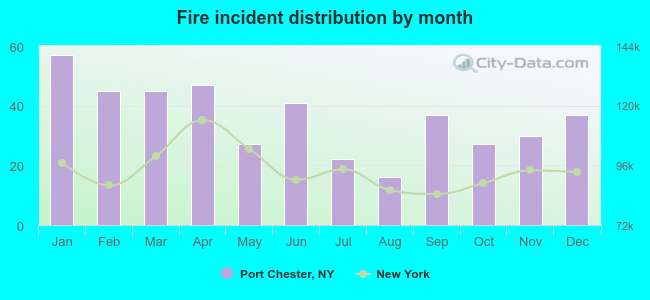 According to the 431 fire incident reports from years 2002 - 2018 most fires (13.2%) took place during January, and the least (3.7%) in August.
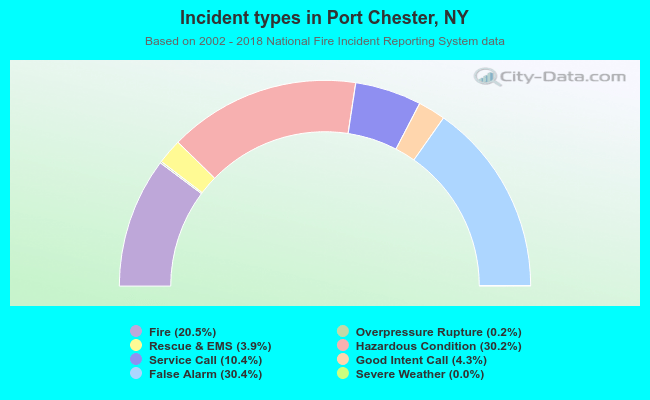 Out of all 2,106 cases reported during the years 2002 - 2018, the most belonged to the categories: False Alarm (30.4%), Hazardous Condition (30.2%), and Fire (20.5%).
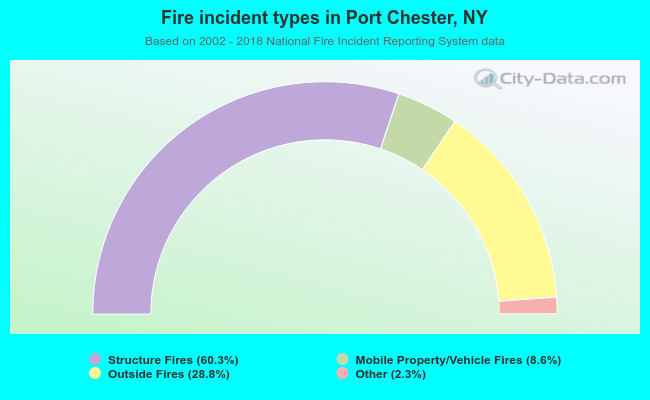 When looking into fire subcategories, the most reports belonged to: Structure Fires (60.3%), and Outside Fires (28.8%).