Scarsdale: Fire Incidents, New York (NY)
Where are fire incidents reported in Scarsdale, NY
Something went wrong! Please refresh the page.
| Fire incidents reported | |
|---|---|
| Sreet name | Count |
| CENTRAL AVE | 70 |
| HEATHCOTE RD | 64 |
| CENTRAL PARK AVE | 62 |
| MAMARONECK RD | 60 |
| BREWSTER RD | 58 |
| GARTH RD | 58 |
| POST RD | 52 |
| WALWORTH AVE | 52 |
| FOX MEADOW RD | 48 |
| GRIFFEN AVE | 40 |
| FENIMORE RD | 34 |
| PALMER AVE | 34 |
| BRITE AVE | 32 |
| MADISON RD | 32 |
| SECOR RD | 32 |
| BOULEVARD | 28 |
| TOMPKINS RD | 28 |
| CHURCH LN | 26 |
| GREENACRES AVE | 26 |
| TUNSTALL RD | 26 |
| UNDERHILL RD | 26 |
| CLAREMONT RD | 24 |
| DEPOT PL | 24 |
| HUNTINGTON AVE | 24 |
| MURRAY HILL RD | 24 |
| OGDEN RD | 24 |
| BLACK BIRCH LN | 22 |
| SPRAIN BROOK PKY | 22 |
| BIRCHALL DR | 20 |
| BRADLEY RD | 20 |
| Other | 549 |
2002 - 2018 National Fire Incident Reporting System (NFIRS) incidents
- Incident types reported to NFIRS in Scarsdale, NY
- 5,88936.9%Hazardous Condition
- 4,57228.6%False Alarm
- 1,64110.3%Fire
- 1,61310.1%Service Call
- 1,3178.2%Rescue & EMS
- 8215.1%Good Intent Call
- 700.4%Severe Weather
- 280.2%Overpressure Rupture
- 280.2%Special Incident
- Fire incident types reported to NFIRS in Scarsdale, NY
- 1,14269.6%Structure Fires
- 24014.6%Outside Fires
- 1398.5%Mobile Property/Vehicle Fires
- 1207.3%Other
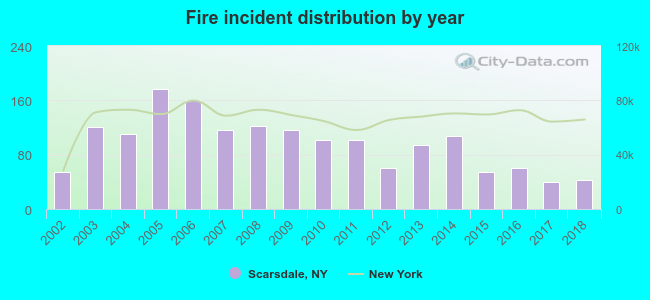 Based on the data from the years 2002 - 2018 the average number of fires per year is 97. The highest number of fire incidents - 176 took place in 2005, and the least - 40 in 2017. The data has a declining trend.
The average number of yearly fire incidents per 10k residents in Scarsdale, NY compared to nearest cities:
(Note: Based on data for the last 3 years, including only cities with population 5,000 and above)
| Scarsdale: | 26.9 |
| Hartsdale: | 102.7 |
| White Plains: | 29.4 |
| Eastchester: | 27.6 |
| Tuckahoe: | 45.8 |
| Greenburgh: | 6.7 |
| Harrison: | 10.5 |
| Bronxville: | 42.1 |
| Dobbs Ferry: | 33.6 |
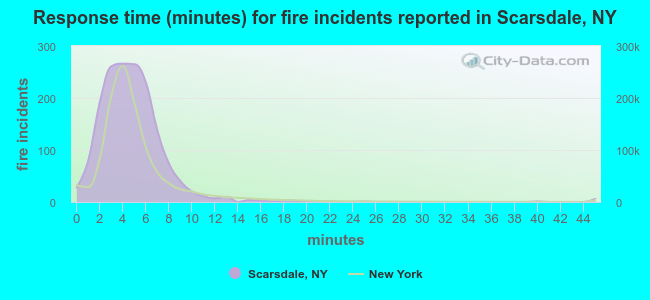 The median response time based on all reported fire incidents is 4 minutes. This is similar to the New York median value.
The median response time in Scarsdale, NY compared to nearest cities:
(Note: Based on data for all years, including only cities with at least 500 fire incidents)
| Scarsdale: | 4 minutes |
| Hartsdale: | 4 minutes |
| White Plains: | 4 minutes |
| Eastchester: | 5 minutes |
| Greenburgh: | 6 minutes |
| Dobbs Ferry: | 3 minutes |
| New Rochelle: | 6 minutes |
| Elmsford: | 5 minutes |
| Larchmont: | 2 minutes |
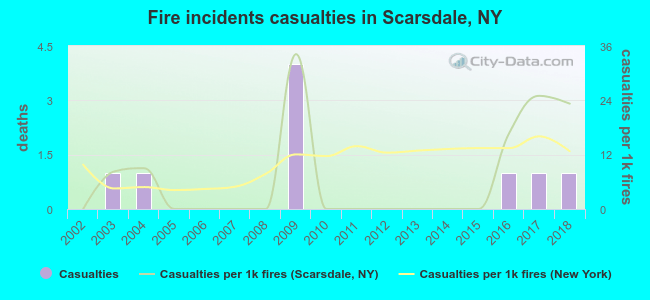 Based on the reports from the years 2002 - 2018 the average number of fire-related casualties per year is 1. The highest number of reported injuries - 4 took place in 2009, and the lowest - 0 in 2002. The data has a rising trend.
The average number of casualties per 1,000 fires is 7. This indicator was the highest - 34 in 2009, and the lowest 0 in 2002. The trend for casualties per 1,000 fires is rising. Compared to the state value the number of injuries per 1,000 fire incidents is lower.
Based on the reports from the years 2002 - 2018 the average number of fire-related casualties per year is 1. The highest number of reported injuries - 4 took place in 2009, and the lowest - 0 in 2002. The data has a rising trend.
The average number of casualties per 1,000 fires is 7. This indicator was the highest - 34 in 2009, and the lowest 0 in 2002. The trend for casualties per 1,000 fires is rising. Compared to the state value the number of injuries per 1,000 fire incidents is lower.Casualties per 1,000 incidents in Scarsdale, NY compared to nearest cities:
(Note: Based on data for all years, including only cities with at least 500 fire incidents)
| Scarsdale: | 5.5 |
| Hartsdale: | 15.9 |
| White Plains: | 7.2 |
| Eastchester: | 11.6 |
| Greenburgh: | 1.3 |
| Dobbs Ferry: | 1.9 |
| New Rochelle: | 2.0 |
| Elmsford: | 0.9 |
| Larchmont: | 8.9 |
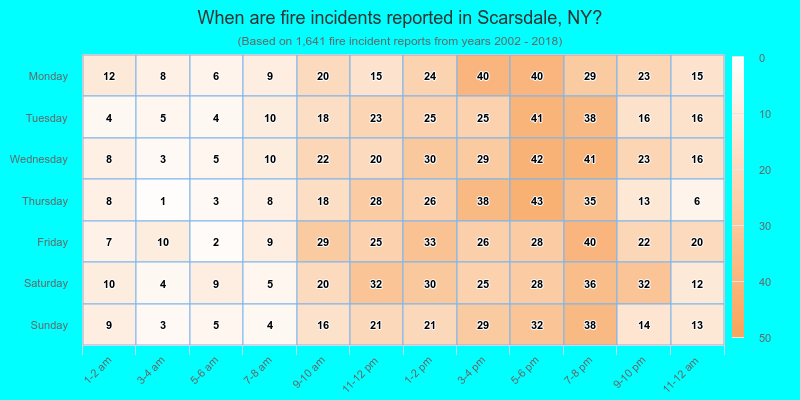
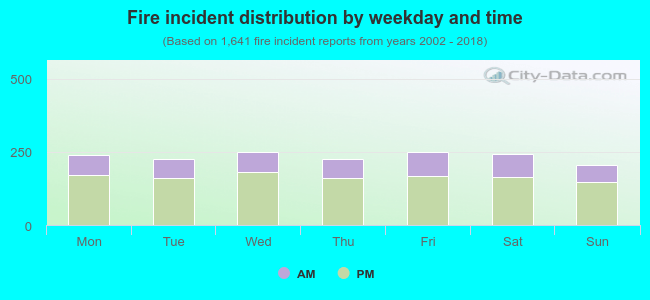 29.7% incidents where reported in the morning and 70.3% in the evening. The most fires (15.3%) took place on Friday, and the least (12.5%) on Sunday.
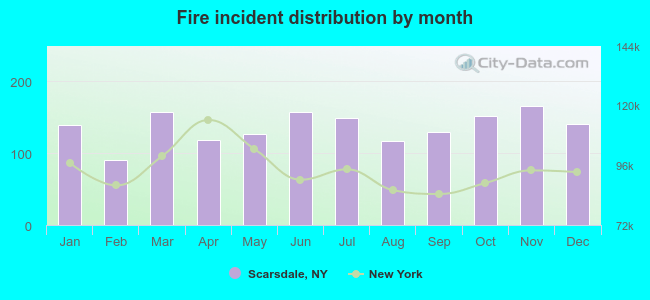 Based on the 1,641 fire incidents from years 2002 - 2018 most fires (10.1%) took place during November, and the least (5.5%) in February.
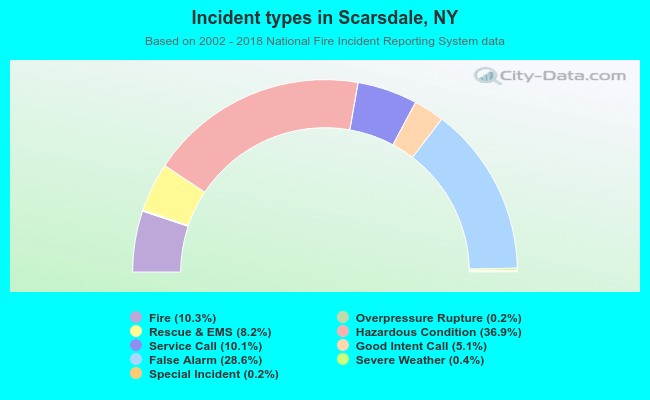 Out of all 15,979 cases reported during the years 2002 - 2018, the most belonged to the categories: Hazardous Condition (36.9%), False Alarm (28.6%), and Fire (10.3%).
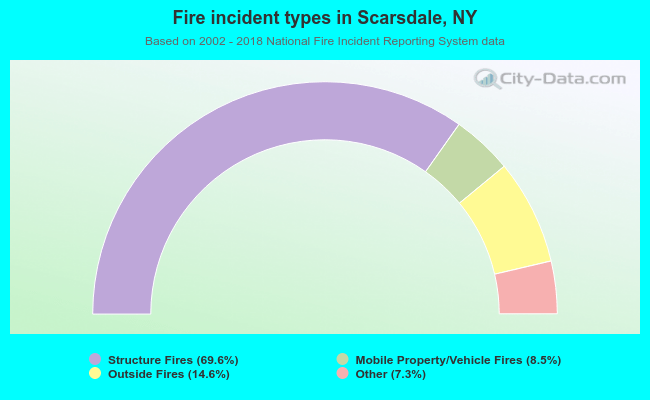 When looking into fire subcategories, the most reports belonged to: Structure Fires (69.6%), and Outside Fires (14.6%).