Provo: Fire Incidents, Utah (UT)
Where are fire incidents reported in Provo, UT
Something went wrong! Please refresh the page.
| Fire incidents reported | |
|---|---|
| Sreet name | Count |
| CENTER ST | 98 |
| UNIVERSITY AVE | 80 |
| STATE ST | 58 |
| 500 ST | 52 |
| UNIV AVE AVE | 52 |
| 900 ST | 42 |
| 300 SOUTH ST | 38 |
| CANYON RD | 38 |
| 100 ST | 36 |
| 600 SOUTH ST | 36 |
| FREEDOM BLVD | 34 |
| CENTER ST ST | 32 |
| 500 NORTH ST | 30 |
| 500 WEST ST | 30 |
| 300 ST | 28 |
| I15SB | 28 |
| 400 ST | 26 |
| 700 ST | 26 |
| SLATE CANYON DR | 26 |
| 200 ST | 24 |
| GENEVA RD | 24 |
| 200 SOUTH ST | 22 |
| 300 WEST ST | 20 |
| 650 ST | 20 |
| 600 ST | 18 |
| 900 EAST ST | 18 |
| NEVADA AVE | 18 |
| STATE ST ST | 18 |
| TERRACE DR | 18 |
| UNIVERSITY AVENUE | 18 |
| Other | 904 |
2006 - 2018 National Fire Incident Reporting System (NFIRS) incidents
- Incident types reported to NFIRS in Provo, UT
- 16,18657.7%Rescue & EMS
- 4,36515.6%Hazardous Condition
- 2,4138.6%Good Intent Call
- 1,9366.9%False Alarm
- 1,9126.8%Fire
- 1,1344.0%Service Call
- 630.2%Special Incident
- Fire incident types reported to NFIRS in Provo, UT
- 81042.4%Outside Fires
- 63333.1%Structure Fires
- 27314.3%Mobile Property/Vehicle Fires
- 19610.3%Other
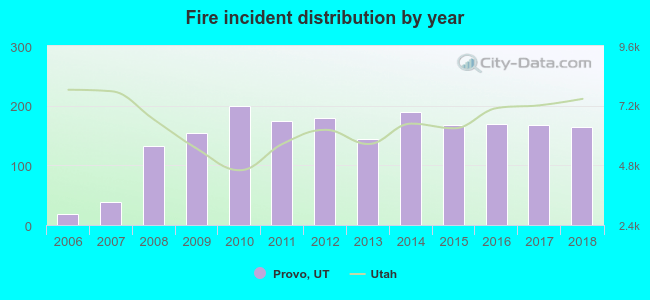 Based on the data from the years 2006 - 2018 the average number of fires per year is 146. The highest number of fires - 200 took place in 2010, and the least - 18 in 2006. The data has a growing trend.
The average number of yearly fire incidents per 10k residents in Provo, UT compared to nearest cities:
(Note: Based on data for the last 3 years, including only cities with population 5,000 and above)
| Provo: | 14.6 |
| Orem: | 14.5 |
| Springville: | 15.4 |
| Lindon: | 20.8 |
| Mapleton: | 7.3 |
| Pleasant Grove: | 12.9 |
| Spanish Fork: | 15.4 |
| American Fork: | 16.9 |
| Cedar Hills: | 5.8 |
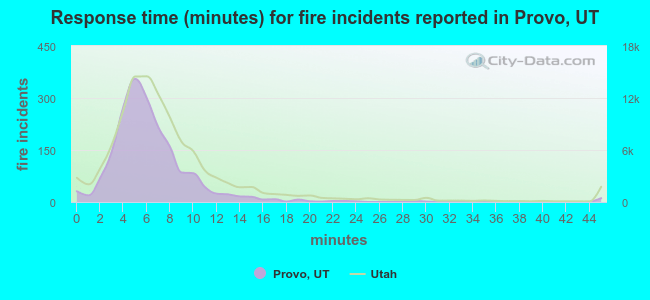 The median response time based on all reported fire incidents is 6 minutes. This is similar to the state median value.
The median response time in Provo, UT compared to nearest cities:
(Note: Based on data for all years, including only cities with at least 500 fire incidents)
| Provo: | 6 minutes |
| Orem: | 5 minutes |
| Springville: | 6 minutes |
| Pleasant Grove: | 6 minutes |
| Spanish Fork: | 8 minutes |
| American Fork: | 7 minutes |
| Payson: | 8 minutes |
| Lehi: | 7 minutes |
| Eagle Mountain: | 9 minutes |
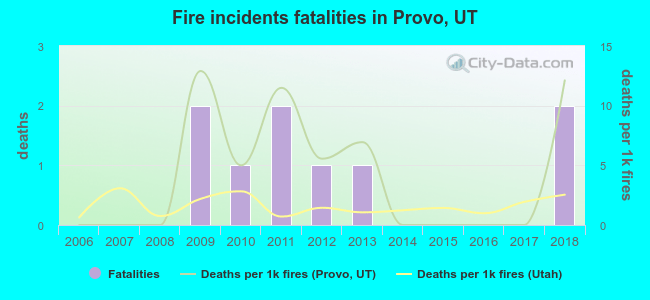 According to the data from the years 2006 - 2018 the average number of fire-related yearly deaths is 1. The highest number of deaths - 2 took place in 2009, and the lowest - 0 in 2006. The data has a rising trend.
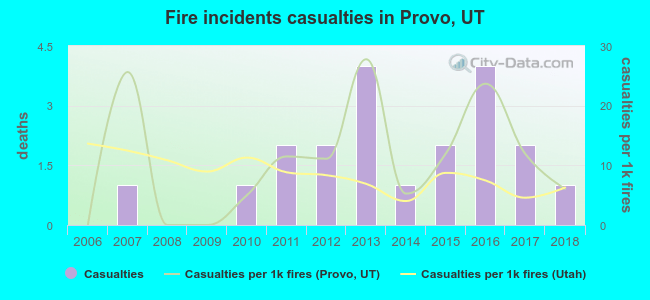 According to the reports from the years 2006 - 2018 the average number of fire-related casualties per year is 2. The highest number of casualties - 4 took place in 2013, and the lowest - 0 in 2006. The data has a rising trend.
The average number of casualties per 1,000 fires is 11. This indicator was the highest - 28 in 2013, and the lowest 0 in 2006. The trend for casualties per 1,000 fire incidents is growing. Compared to the Utah value the number of injuries per 1,000 fires is similar.
According to the reports from the years 2006 - 2018 the average number of fire-related casualties per year is 2. The highest number of casualties - 4 took place in 2013, and the lowest - 0 in 2006. The data has a rising trend.
The average number of casualties per 1,000 fires is 11. This indicator was the highest - 28 in 2013, and the lowest 0 in 2006. The trend for casualties per 1,000 fire incidents is growing. Compared to the Utah value the number of injuries per 1,000 fires is similar.Casualties per 1,000 incidents in Provo, UT compared to nearest cities:
(Note: Based on data for all years, including only cities with at least 500 fire incidents)
| Provo: | 10.5 |
| Orem: | 3.8 |
| Springville: | 3.5 |
| Pleasant Grove: | 4.4 |
| Spanish Fork: | 1.2 |
| American Fork: | 5.9 |
| Payson: | 4.7 |
| Lehi: | 5.8 |
| Eagle Mountain: | 0.0 |
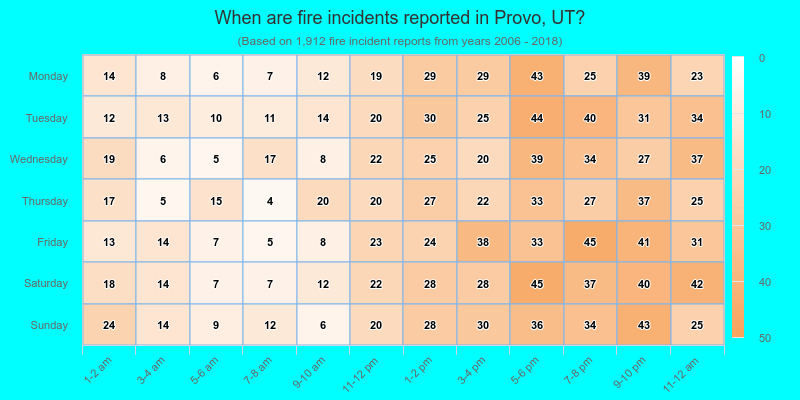
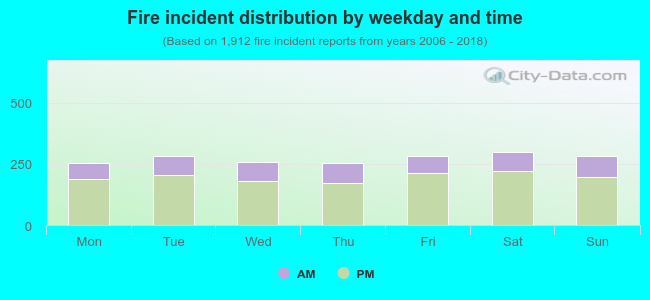 28.2% incidents where reported in the morning and 71.8% in the evening. The most fires (15.7%) took place on Saturday, and the least (13.2%) on Thursday.
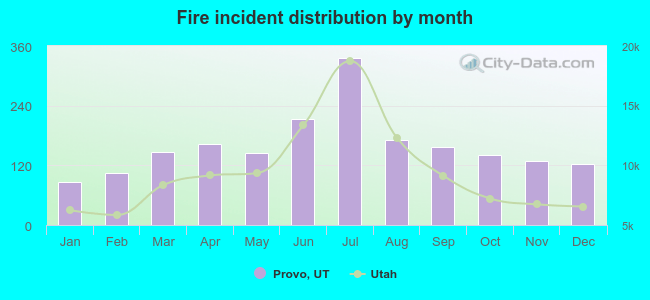 Based on the 1,912 fire incidents from years 2006 - 2018 most fires (17.6%) took place during July, and the least (4.5%) in January.
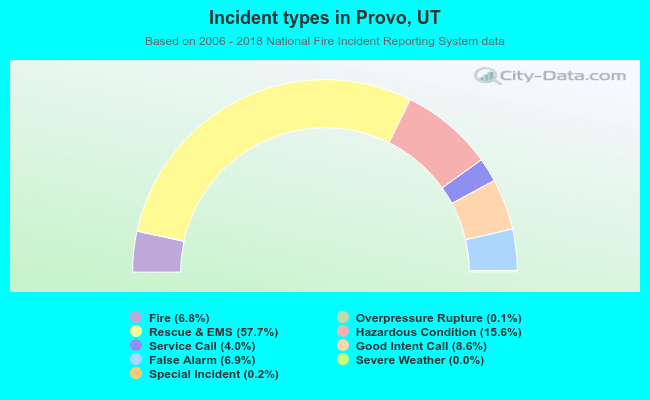 Out of all 28,040 cases reported during the years 2006 - 2018, the most belonged to the categories: Rescue & EMS (57.7%), Hazardous Condition (15.6%), and Good Intent Call (8.6%).
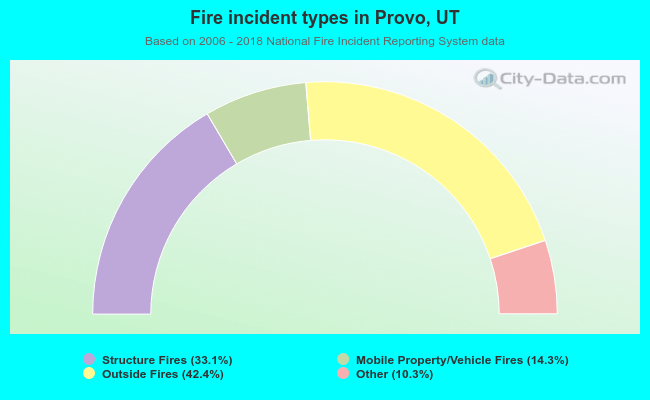 When looking into fire subcategories, the most reports belonged to: Outside Fires (42.4%), and Structure Fires (33.1%).